The Complete Flows, Technicals & Positioning Market Summary As We Enter The Second Half
Here we are on the last day of the first half of 2025 with the S&P trading at new all time highs, because of what Goldman's Pierre Saboreault calls rapidly improving sentiment, which can be seen as a result of the cease-fire in the Middle-East, the resulting drop in Oil prices, and the incrementally dovish narrative from Fed speakers as well as superficial easing in trade and tariff negotiations.
Taking a closer look below the surface, Megacap Tech has taken back its leadership role (up 6% last) with the AI bubble raging once more (GSTMTAIP +502bps on the week); Meanwhile, the retail bid is clearly visible through the lens of Goldman's Non Profitable Tech (+856bps), Retail Favorites (+450bps), and Memes (+354bps) baskets.
According to the Goldman trader, the latest burst of buying from Fundamental investors (as noted earlier, there has been $7bn of net demand on Goldman's US desk from Long Onlys over 5 days, in a combination of long buying and short covering in US shares from Hedge Funds according to our PB data) was the springboard for a new record close by the S&P500 on Friday, with the index gaining +344bps on the week. Interestingly, the "non-economic players" seemed mostly sidelined in that context, with subdued buyback flow from Corporates according to Goldman's buyback desk.
Meanwhile, CTAs are net selling on the week and inflows into Equity Mutual funds have significantly decelerated from the week prior.
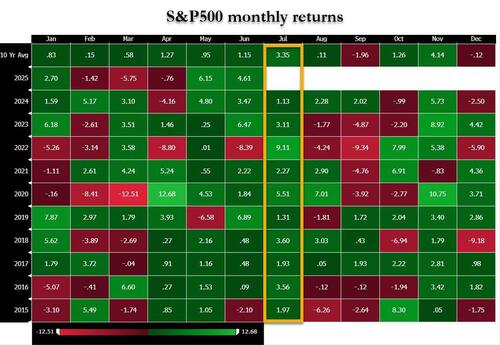
Putting it together, Saboreault says that as we head into one of the strongest seasonal periods of the year for the S&P, which as shown in the chart below has not seen a red July in the past decade...
... a combination of potential chasing from Fundamental players and a pick-up in technical demand could prolong the index momentum. Watching ISM Manf (Tues) and NFP (Thurs) as the two main macro events for the (US holiday shortened) week, and more commentary from Powell and global central bankers out of the annual ECB Forum in Sintra.
Taking a more detailed look at the various Goldman trading desks, we start with the bank's prime brokerage:
HEDGE FUNDS - Prime Brokerage:
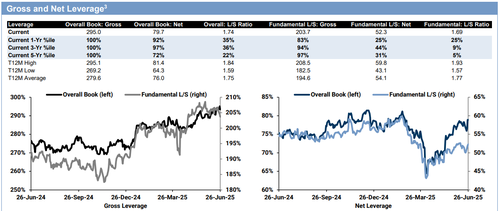
Global: Overall book Gross leverage +0.6 pts to 295% (5-year high) and Net leverage +2.5 pts to 79.7% (92nd percentile 1-year). Overall book L/S ratio +1.7% to 1.740 (35th percentile 1-year). Fundamental L/S Gross leverage -2.5 pts to 203.7% (83rd percentile 1-year) and Net leverage +2.1 pts to 52.3% (25th percentile 1-year).
Global equities saw the largest net buying in 5 weeks (+1.6 SDs 1-year) driven by long buys and to a lesser extent short covers.
Every major region (sans Europe) was net bought, led by North America and EM Asia. Macro Products made up 70% of the total notional net buying, driven by both long buys and short covers, while Single Stocks were net bought for a 7th straight week led by long buys. 6 of 11 global sectors were net bought, led by Financials, Info Tech, and Industrials, while Energy, Comm Svcs, and Real Estate were the most net sold.
Europe: Risk-on flows were observed in Europe this week. The book was net sold with new shorts outpacing new longs. Europe remains overweight vs MSCI world on our book by 3.36% down 0.79 ppts WoW. North America continues to be underweight, at -7.46%, reduced by 1.34ppts.
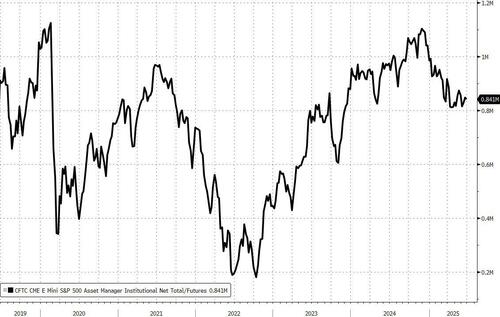
ASSET MANAGERS : Institutions were marginal sellers in the week ending June 24th. Overall non-dealer position edged higher.
MUTUAL FUNDS - EPFR ($30Tn AuM, Global funds): Net flows into global equity funds were modestly positive in the week ending June 25 (+$3bn vs +$45bn in the previous week). In G10, US equity funds saw net negative flows, driven by foreign investors. Flows into Western Europe equity funds cooled as European investors slowed their net purchases. In EM, South Korea continued to see robust net equity inflows; flows into Brazil turned negative on the week. At the sector level, technology and energy sector funds saw the largest net outflows.
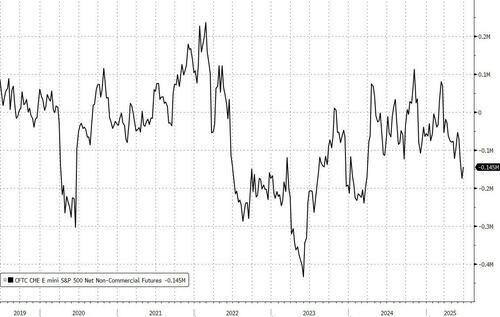
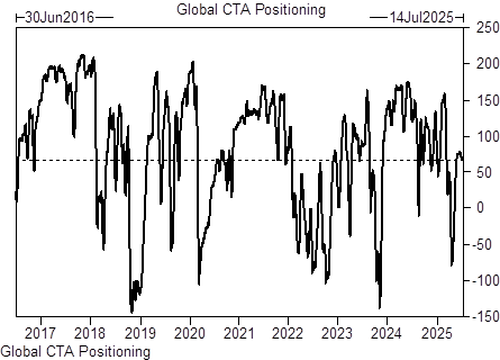
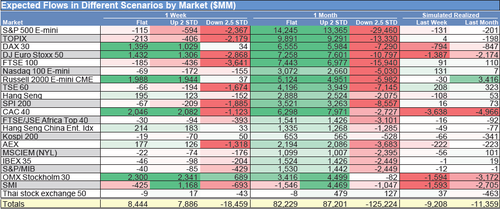
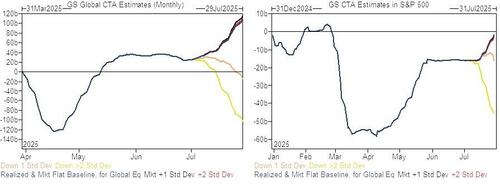
SYSTEMATIC: In Goldman's latest update, the bank's models estimated CTAs had sold $9.2bn of Global Equities on the week, lowering their overall exposure to +$67.9bn (61.5th percentile over a year). While the one-week horizon is fairly benign, the bank's models anticipate $82bn of BUYING over a one-month-horizon in a flat market scenario.
CORPORATES: Supply (IPOs) vs Demand (Buybacks):
- Issuance: $6.48bn worth of IPOs/Addl in North America on the WEEK / $177.64bn of IPOs in North America YTD.
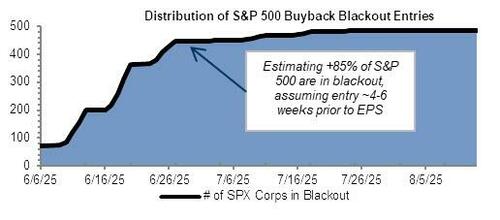
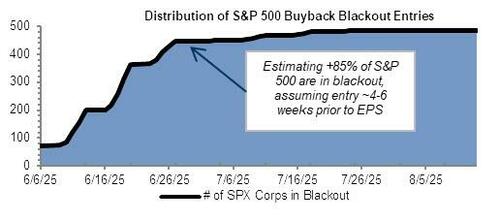
- Buybacks: Goldman's dedicated US buyback desk, on June 30rd: "Light volumes this past week as corporates remain in their blackout window ahead of earnings. Companies will start to exit blackout as they release earnings; we typically estimates this happens ~1-2 days post EPS. Our volumes last week finished 0.5x vs 2024 YTD ADTV and 0.6x vs 2023 YTD ADTV skewed toward Financials, Tech, and Health Care. In terms of the current blackout window, we estimate +85% are in blackout window today with +88% in blackout by the end of the week. July tends to be a lighter volume month on our desk given the blackout window and summer volumes"
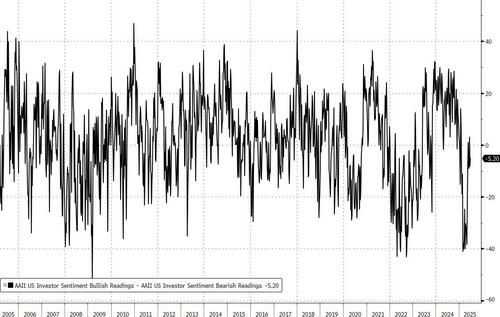
RETAIL - AAII SENTIMENT SURVEY: Neutral. On the week ending June 25th, Bulls were up 1.9 points to 35.1%, Bears down 1.1 points to 40.3%, while Neutrals were down 0.7 points to 24.7%. To compare to historical averages of Bulls 37.5% / Bears 31% / Neutral 31.5%.
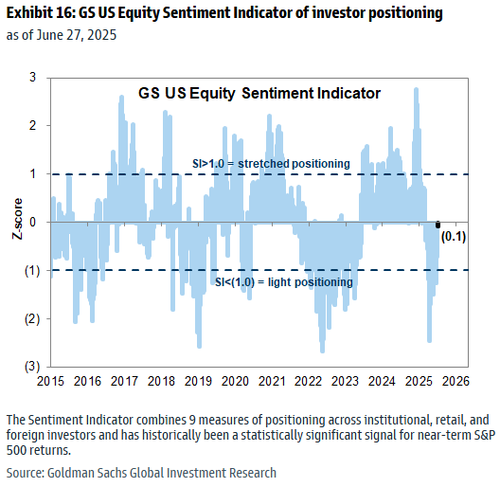
GS SENTIMENT INDICATOR: Goldman's Sentiment Indicator (SI) bounced to -0.1 this week, from -0.7 last week, now in Neutral territory.
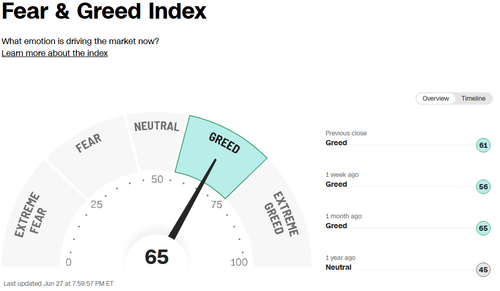
CNN Fear & Greed Index: Bounced, now in ‘Greed’ territory at 65/100, down from 56/100 a week ago.
More in the full note available to pro subscribers.


