Goldman: This Market "Feels Like Hotel California"
According to Goldman trader Edoardo Greco (who claims he is not much into either music nor metaphors) Hotel California’s punch line "you can check out any time you like, but you can never leave" has felt like the best way to describe the current equity-gold chase by the investor community: as he explains, "There are no decent alternatives to equity & gold when the bulk of the fixed world barely returns 2% in real terms… and, yes, gold is outperforming but not yet at the levels of the 70s."
Below we excerpt from his full note (available to pro subs in the usual place):
Debasement is the leitmotif that keeps investors invested where they are and – as the charts below indicate – there is not a clear sign to stop the melt-up looking at fund flows, expected US household demand into 2026, support from dealer gamma and medium-term CTA signals still positive, and a bar that looks comfortably low both on macro and micro. Indeed, US GDP growth is expected at a meager 0.9% annualized for Q4 2025 and analysts are forecasting 0% EPS growth for Europe this season with US names like META, NFLX, AMZN & MSFT all head into 3Q earnings at / below levels they were into 2Q prints.
Despite the scare experienced on Friday, as tariffs came back center-stage, economist Jan Hatzius’s latest update on the topic sees the effective tax rate at 15.5% in 2026, a lower level than previously assumed and even with a further boost in 2026, Goldman Research still see inflation normalizing at 2% by end-26 net of tariffs. Yet on Friday US stocks experienced the worst 1-day sell-off since April, with global equities seeing the largest 1-day notional net selling since April 3rd – bulk of the flow was almost entirely driven by short sales. As noted previously, investors are hedging rather than unwinding their longs as suggested by the small decline in SPX funding spreads on the day.
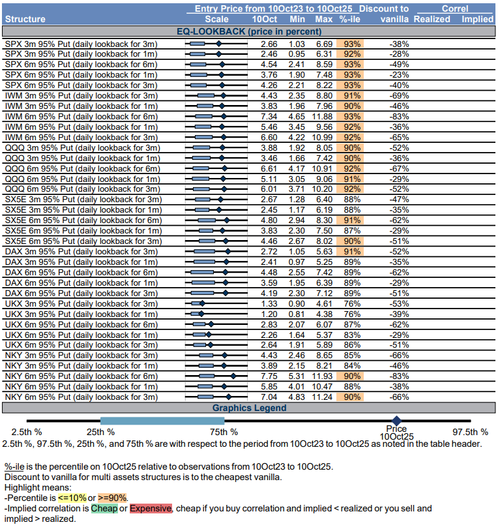
If you sum all this together, it is hard for traders to feel compelled to reduce equity exposure. However, as Greco notes, for the 1st time in a while, lookback options don’t feel that cheap anymore… and yet this is probably why you should consider them at this point of the year given:
- Trump – XI meeting at the end of Oct is open to a wide range of outcomes. Expect a harsh narrative into the event as both sides prepare the negotiating table.
- Today US large cap banks reported, as exp, solid results, yet it’s hard to see outperformance. The opportunity set for US financials remains benign, yet early signs of investor fatigue?
- 99% of US companies will be in blackout, with no meaningful inflection until 27 Oct. We are still in a data blackout too given the US government shutdown and US labour growth ex healthcare remains very weak.
Excluding unknown risks (i.e. recession, credit quality concerns, AI trajectory & capex) and reading the latest headlines from Powell on the Fed’s balance sheet further boosting markets...
- *POWELL: FED MAY END BALANCE-SHEET RUNOFF IN COMING MONTHS
... you should the opportunity when vol normalize to consider adding some protection.
CHARTS & REPORT SUPPORTING VIEWS
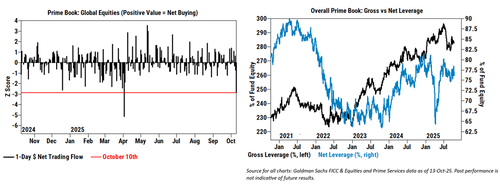
PRIME BROKERAGE ON FRIDAY - From a flow perspective, global equities saw the largest 1-day notional net selling since April 3rd (-2.9 z score one-year), driven mostly by short sales. Within the US, Macro Products (Index and ETF combined) collectively made up 86% of the total net selling, driven almost entirely by short sales. Together with record option volumes, and a small decline in SPX funding spreads on Friday, this suggests increased hedging activity (instead of significant long unwinds).
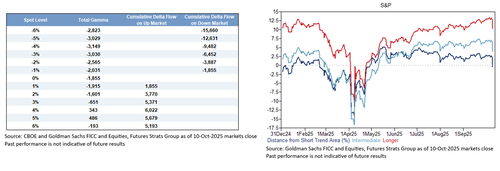
POSITIONING, GAMMA PROFILE, CTAs TREND – GS sentiment indicator slightly positive after 31 consecutive negative readings. Only passive fund flows and retail margin debt, out of nine indicators, are >1StDev above 52-week average. CTAs have max longs across SPX, NDX, RTY (99%ile across all three). 6,290 is the trigger level of BIG supply. 99% of companies in blackout, inflection won’t start until 27th Oct. Retail continued to buy on Friday despite the move lower, GSR expect households to still represent the largest source of equity demand next year. CTAs: 100% of medium-longer term signals still positive. If the market rebounds and vol subsides, the selling would be even smaller, and conversely there is ample room to grow larger if downside continues, with length near an 8.5 out of 10. Short trend is positive by 1.7% in the median global market currently, while medium trend is somewhat further away at >5% below spot and near 6300 in SPX.
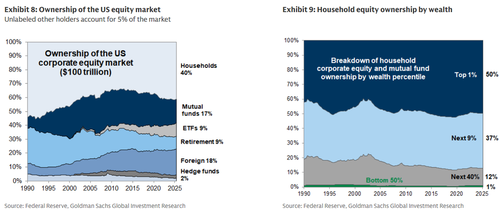
DRIVERS OF US EQUITY DEMAND – NO SIGN OF END OF US EXCEPTIONALISM…YET - Despite debates around US exceptionalism, foreign investors have been the largest source of US equity demand YTD, and Goldman expects a slower pace of buying next year totaling $250 billion (-56% year/year). Foreign investors bought nearly $280 billion in May and June this year, continuing the usual pattern of elevated foreign investor demand after the dollar has weakened and US equities have underperformed. The bank expects mutual funds and pension funds will remain the largest sellers of equities in 2026, and forecasts mutual funds will sell $580 billion of equities due to low current cash balances and persistent outflows from active funds. Elevated current funding statuses support our forecast for $200 billion of net equity supply from pensions as they rotate from stocks into fixed income. Households directly own 40% of the US equity market, and nearly 90% of those equity assets belong to the wealthiest 10% of households. According to the Federal Reserve, the top 1% of households by wealth own $26 trillion of corporate equities and mutual funds, accounting for 50% of aggregate household equity ownership. The bottom 50% of households hold just $0.5 trillion, or 1% of the total.
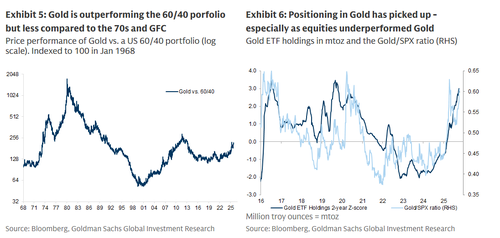
DEBASEMENT: GOLD OUTPERFORMING BUT LESS COMPARED TO THE 70s – At a macro-level, the FX debasement trade dominates as investors looks for 'hedges' for broad debasement concerns. Gold delivered one of its highest 6-month returns over the past 40 years and Goldman's commodities team raised their Dec2026 gold price forecast to $4,900/toz (vs. $4,300 prior) on sticky inflows. Gold has proven to be an important diversifier for the standard US 60/40 portfolio historically in the 1970s and around the GFC. However, ETF Gold holdings have picked up, tracking Gold's outperformance vs. equities
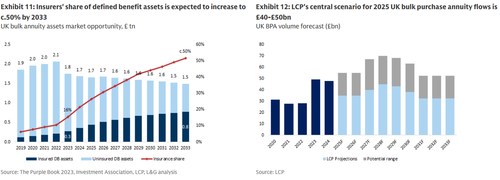
THEME TO TRACK - UK Life Insurance and Annuities are the next stop for Alternative AMs - US PE-owned lifeco assets have grown at a 30% CAGR since 2012 and now represent c.10% of admitted assets across the total US life insurance industry. The business model is based on the synergistic relationship between a primary life company, an affiliated alternative asset manager and an affiliated offshore reinsurer, allowing for multiple sources of spread and fee-based earnings in a capital efficient manner. Asset growth has been both organic and inorganic, with a particular focus on annuities (a permanent capital source) and private asset origination (enhanced spread / core AM competency).
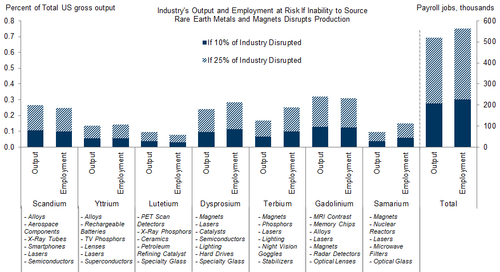
RARE EARTHS – escalation to gain leverage ahead of APEC meeting in SK (31 Oct, 1 Nov). Wide range of outcomes. With Sec. Bessent and Vice Premier He Lifeng also potentially meeting in Frankfurt in coming weeks, the escalation from both sides could be interpreted as setting the table with additional negotiating points ahead of the end of the current tariff pause on November 10. Hatzius 12 Oct
CHART 1: Limits on Rare Earth Exports Could Threaten US Production of Many Goods
Source: Goldman Sachs GIR
TARIFFS & INFLATION – Not yet seen the full boost but Goldman Research estimate slightly trimmed - The US effective tariff rate implied by customs duties had risen by 9pp through August, or by nearly 11pp net of frontloading effects. Following recent tariff increases on some products and countries and hints of exemptions for others, Goldman now expects it to rise by 12pp in total in 2025 and by another 3.5pp or 15.5pp in total through 2026, a bit less than previously assumed. Passthrough to consumer prices has reached 55% after six months, meaningfully lower than at the same point in 2019. Our analysis implies that tariff effects have raised core PCE prices by 0.44% so far this year. The bank's forecast of additional tariffs combined with its baseline assumption that peak passthrough will rise further from 55% to 70% implies a further 0.6% boost from tariffs through next year, leaving core PCE inflation at 3.0% year-over-year in December 2025 (or 2.2% net of tariff effects) and 2.4% in December 2026 (or 2% net of tariff effects). If tariff passthrough instead peaks at 100%, core PCE inflation would be 3.1% at end-2025 and 2.7% at end-2026, while if passthrough rises no further than the current 55%, it would be 2.9% at end-2025 and 2.2% at end-2026 .
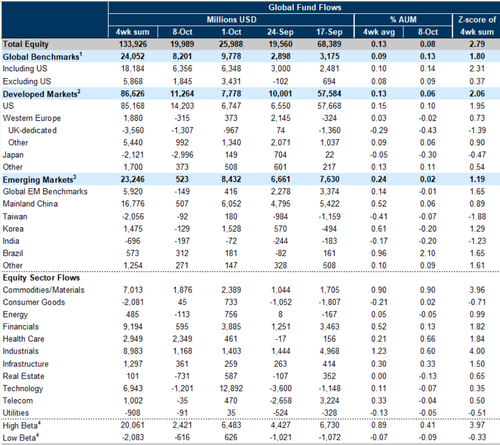
WEEKLY FUND FLOWS STILL OK - Net flows into global equity funds slowed, but remained firm in the week ending October 8 (+$20bn vs +$26bn). G10 equity funds saw stronger net inflows, driven by greater demand for US equity funds. Meanwhile, flows into Japanese equities turned negative.
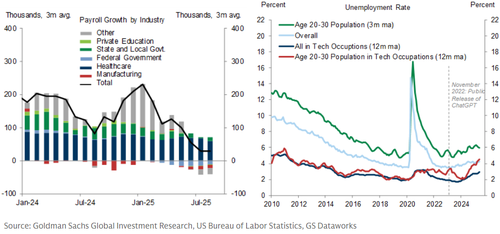
Jobless Growth: Very weak job market seen already outside of healthcare (left chart) but so far unemployment rate creeping higher only in young tech workers, driven by AI adoption. The majority of US potential GDP growth to stem from AI, with limited contribution from labour supply growth due to aging and lower immigration.
As Greco concludes, "LOOKBACK OPTIONS ARE NOT CHEAP LOOKING AT HISTORY, YET IT’S YOUR BEST WAY TO REMOVE TIMING RISK AROUND YOUR HEDGES."


