How Much Of A Bubble Are We In? UBS Strategists Expose Warning Signals Of A Peak
Wall Street chief executives said investors should brace for an equity market drop of more than 10% in the next 12 to 24 months, and that such a correction may be a positive development.
Bloomberg reports that corporate earnings are strong but “what’s challenging are valuations,” said Mike Gitlin, who helps oversee about $3 trillion as president and chief executive officer of investment manager Capital Group, during a financial summit organized by the Hong Kong Monetary Authority on Tuesday.
On whether stocks are cheap, fair or fully valued, Gitlin said most people “would say we’re somewhere between fair and full, but I don’t think a lot of people would say we’re between cheap and fair,” he said.
The same goes for credit spreads, Gitlin added.
His views were echoed by Morgan Stanley CEO Ted Pick and Goldman Sachs Group Inc.’s David Solomon, who also see the possibility of a significant selloff in the coming period and said pullbacks are a normal feature of market cycles.
Pick said markets have come a long way, but there’s still “policy error risk” in the US and geopolitical uncertainty.
“Yes markets seem expensive...but the reality is that systematic risk has probably narrowed,” he said. There will be more focus on company earnings in 2026 and there will be greater dispersion, where stronger firms will outperform while weaker ones will lag, he said. In addition, the new issue market is active around the world “and investors want to take risks.”
“We should also welcome the possibility that there would be 10 to 15% drawdowns that are not driven by some sort of macro-cliff effect,” Pick said, calling that “a healthy development.”
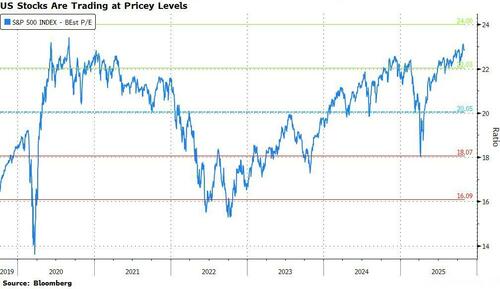
The S&P 500 index is trading at 23 times forward earnings estimates, above its five-year average of 20 times. Similarly, the Nasdaq 100 Index fetches a multiple of 28 times, compared with nearly 19 times in 2022.
Markets are most irrational at the heights of a bull market and the depths of a bear market, said Citadel Chief Executive Officer Ken Griffin, who added that now “we are very deep into a bull market.”
So with Wall Street CEOs trying to be sanguine, but admitting there is risk, UBS Equity Strategist Andrew Garthwaite and his team investigate 'how much of a bubble we are in' and explain what the warning signs of a peak look like from here...
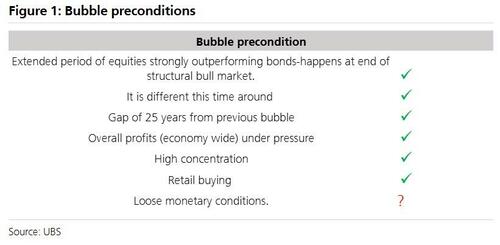
We have long argued that there are 7 preconditions for a bubble and if the Fed cut in line with the UBS forecast, then we have all 7.
In brief, bubbles occur when:
i) Buy on dip mentality: this occurs when equities outperform bonds by more than 5% a year for more than a decade. Equities have outperformed by 14% a year over the past decade.
ii) When ‘it's different this time around’ owing to major new technology or dominance. We have both.
iii) A gap of 25 years from the previous bubble (Nifty 50 in 73, TMT in 1998 and Gen AI in 2023). Hence, a new generation can believe ‘it is different this time around.’
iv) Overall profits under pressure: this was the case in the TMT period (when national accounts profits fell), Japan in the late 80s (when profits were flattered by zaitech trading). Today outside the top 10 companies in the US, 12 month forward EPS is close to zero.
v) High concentration. We are at record levels of concentration in terms of market cap and revenues
vi) Retail buying. This has clearly been seen in many regions (India, US, Korea).
vii) Loose monetary conditions: if the Fed cut in line with UBS forecast, we have loose monetary conditions. Financial conditions are already loose.
The rationale for a bubble in our mind is much clearer than it was in the previous bubbles we have witnessed (Japan in late 80s, TMT, Red Chip to name but a few).
If Gen AI is perceived to increase productivity from 2028 as much as TMT temporarily did (c2%), then it is easy to justify c20-25% upside- the speed of adoption makes Gen AI unique.
The additional justification this time is that government balance sheets, relative to their norm, are much risker relative to corporate/ bank balance sheets (in the TMT period, the US government was running a budget surplus)...
...and there is at least a chance in our opinion that governments eventually print to resolve the issue (leading to a switch from nominal into real assets).
This would be accelerated if the Fed was perceived to lose its independence.
What marks the peak of a bubble:
1) Very clear overvaluation.
There are 5 different approaches to this:
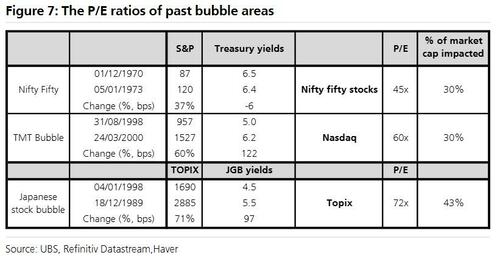
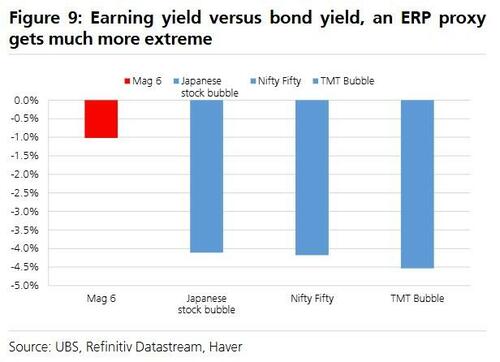
i) The P/E rises to c45X to 73X for at least 30% of market cap on a 10 year bond yield of, at least, 5.5% in previous bubbles. Currently, the Mag 6 trade on 35X 12 month trailing;
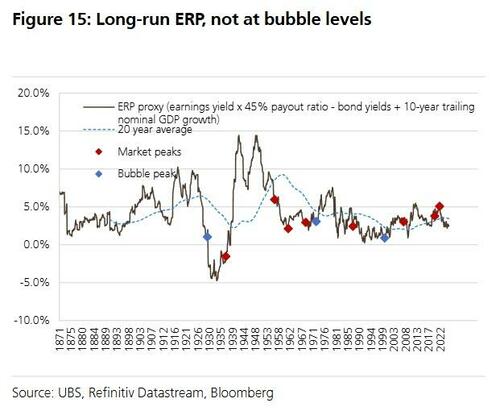
ii) The ERP falls to c1% (2000, 1929);
iii) Investors move away from conventional valuations to unconventional (land value in Japan in 1989 or eyeballs in TMT) or just focus relative value;
iv) TAMs (Total Addressable Market) required to justify valuations become very unrealistic. At the peak of TMT, around a fifth of household income needed to be spent on telephony to justify valuations. We calculate if by 2030 1.3% of GDP is spent on semis, then valuations are reasonable (semis and software are the new oil and today amount to c3% of GDP, oil averaged 3% of GDP but peaked at 10%);
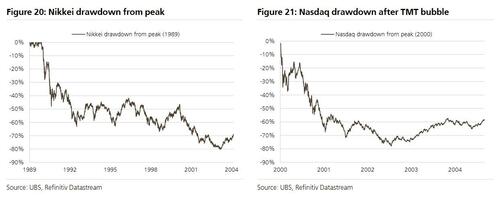
v) the overvaluation is so acute when the bubble burst, investors lose 80% (very hard to see being the case currently).
2) Long term catalysts of peak:
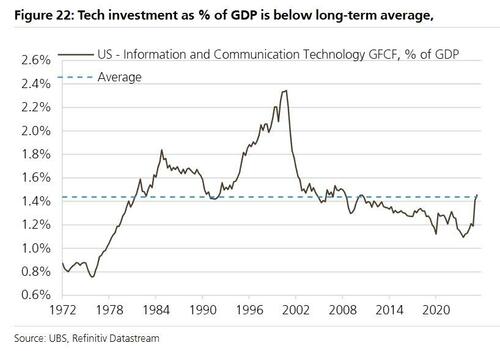
i) clear cut over-investment; ICT investment as % of GDP is well below 2000 levels and close to normal levels;
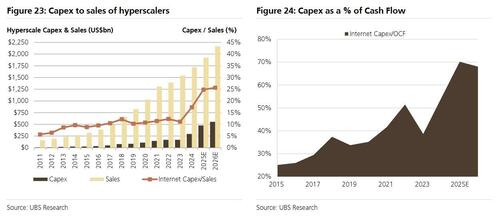
ii) excessive debt financed spending (currently the top 11 hyperscalers in aggregate can increase capex by 40% before they fund out of debt using 2025 revenue numbers)- leverage of tech today is much better than that of tech or telecoms during the TMT bubble despite Open AI's ‘vendor financing’;
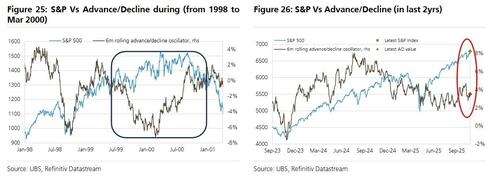
iii) much larger loss of breadth (in 1999 nearly twice as many stocks fell as rose despite the Nasdaq nearly doubling);
iv) overall national account profits come under much more pressure (during TMT national accounts profits fell, unlike now and this explains the narrow breadth point above);
v) corrections, the Nasdaq had 5 corrections of more than 10% in 1999, since April there has been none;
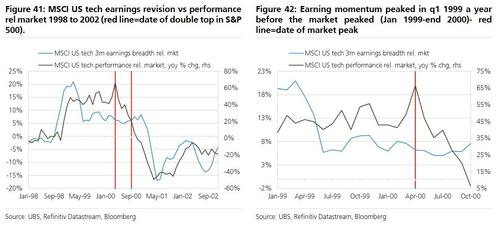
vi) earnings momentum peaked a year before the market peak;
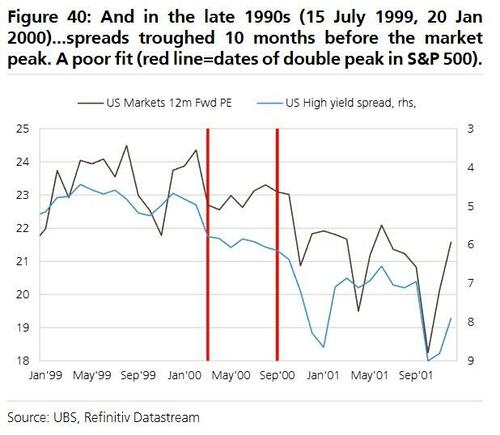
vii) credit spreads troughed 10 months before the market peak in 2000.
3) Near term catalysts of a peak:
i) extreme M&A (Vodafone/ Mannesmann closed in Feb 2000 and AOL/ Time Warner was announced in Jan 2000 and if we pro rata for the rise in the S&P since then each deal would equate c$0.9trn today);
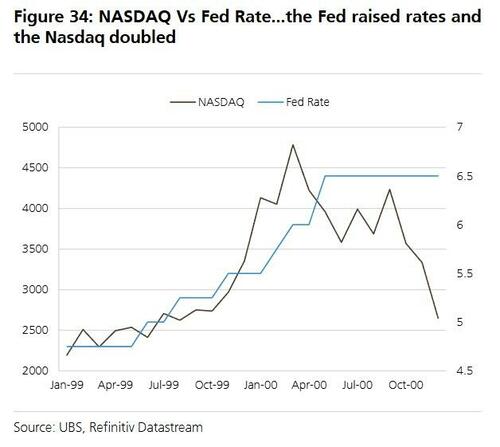
ii) central banks moving to a tight policy- as the Fed raised rates from 4.75% to 5.75%, the Nasdaq almost doubled- it was only when the Fed raised rates above 6% and close to nominal GDP after Feb 2000 that the market peaked (nominal GDP in 2026 is projected to be 5.2% thus we are far away from this)- in the case of Japan it was appointment Yasushi Mieno to be Governor of the BOJ on Dec 17th 1989 and the subsequent rate hike on December 26th;
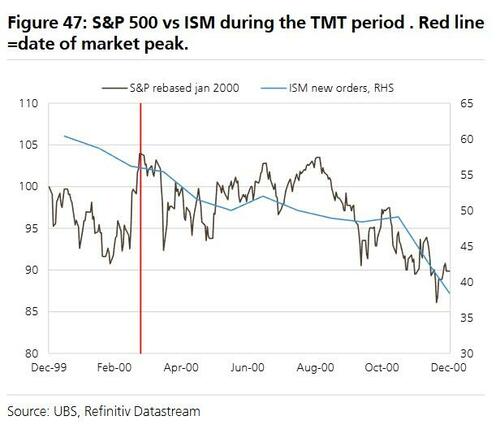
iii) sharp fall in ISM new orders. ISM new orders fell by 17 points in the 10 months after the market peaked; iv) extremes in price momentum (semis rose to be 70% above their 200 Daily MA relative to the market compared to 35% now); v) people stop asking if it is a bubble because they have rationalised it.
Lessons after TMT peaked
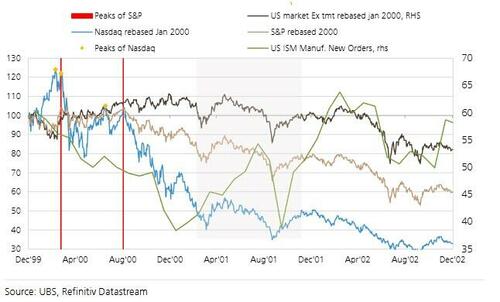
i) into the initial sell-off, non TMT rose 11%;
ii) there was an echo effect (ie double top Sept 1st for the S&P 500 after the initial peak on March 24th S&P 500;
iii) the bear market for the S&P occurred as we moved into a recession (the 22 point collapse in ISM new orders from 60 to 38 between January 2000 and January 2001 with a recession starting in Feb 2001);
iv) The concept was right but the price was very wrong: MSFT, Amazon and Apple fell between 65% to 94% from peak and it took them 5 to 17 years to get back to previous peak. There is a similar story with many of the Nifty 50.
v) The value chain may be different. The winners from the TMT bubble were not the telecom operators but the users who were able to capture the value chain (Apple) or exploit social media (Meta, Google) or the critical software that could not be disrupted (MSFT).
Right now
The P/E of tech are close to their norm relative to the market, earnings revisions are better, earnings growth is better, and we are early inning in capex, and we have very few of the excesses above.
If there is bubble it may be in the high margins which will probably come down as businesses become more capital intensive and competition grows.
Garthwaite and his team conclude: we still think this is the early stage of a potential bubble.
Professional subscribers can read UBS' full 'How much of a bubble are we in? What are the warning signals of a peak?' note here at our new MarketDesk.ai portal...


