The SaaS Time Bomb Inside BDCs: A Deep Dive Inside The Next Private Credit Crisis
In a note published overnight by JPMorgan credit analysit Kabir Caprihan, the financial analyst picks up where we left off yesterday with "Private Credit Stocks Crash After Shock Report Reveals Huge Exposure To Collapsing Software Sector", and writes that, even though it may not seem like it, BDC analysts had "considered, evaluated, and discussed exposure to software within the sector over the last 12-18 months." In fact, Caprihan notes, "it was the most discussed topic at our conference last year, as every management team was asked the question."
So, when software loans dropped this week and BDCs crashed, some of the frustration from the analyst community was understandable according to the JPM analyst: "It just feels like any part of the market can “sneeze” and according to the market, the BDCs have the flu or a cold."
Sure enough, in its mid-day wrap, Goldman highlights the "relentless weakness in software continuing today, and testing April liberation day levels with the sector down 9 of the last 12 sessions." The bank's software vs semis pair (GSPUSOSE) is down a whopping -495bps today and is an epic disaster over the longer-term.

To explain the unprecedented collapse in software, GS clients are are citing
- Anthropic new launch capabilities for its agentic Cowork facility,
- A couple EPS moves lower in AI at risk company’s across the mkt (Publicis -10% in France, IT -26% on earnings), and
- Current momentum dynamics: Pro-Momentum tape = bad for Software
So is Caprihan saying that the market reaction is exagerated:? Well, not exactly: wxposure to software is about 16% of the loan portfolio for the BDCs that he tracks, and concedes that if AI technology is the end of software companies, then yes, BDCs will feel the pain... although there will be winners and losers among the BDCs as each manager is different.
To avoid throwing out the baby with the BDCwater, in its report (available to pro subs) JPM provides the latest data on software exposure for the industry, brings out its bank stress model on these portfolios, and shares thoughts on recent pricing.
Starting at the top, as of the third quarter of 2025, the total investment portfolios across the 30 BDCs tracked by JPM is $359bn, of which, software is ~$70bn or about ~16%. The exposure varies from Blue Owl Technology Fund at about 40% of the fund to TSLX being negligible. Note that the total technology exposure is around $80bn (here we are only outlining the exposure that is classified as software). It is not possible to capture total exposure as some technology companies may be classified in the sector that they serve, i.e. AthenaHealth is a healthcare technology company that was under slight pressure this week, but under BDC schedule of investments (SOI), is classified as healthcare and not technology or software.
Last year, when JPM discussed the prospect of AI’s impact on software companies, the common theme was that management teams were aware of the threat of AI to their portfolio companies. While management teams have attempted to focus on “mission critical” software companies, they are taking this threat seriously and have completed bottom-up analyzes of their software books. Furthermore, BDCs score the AI risk for each software company and while all management teams stated that they are comfortable with continuing to invest in software, only one management team discussed pulling back from software until more clarity is available.
Where does JPM stand on this? Caprihan's answer is that "we believe that nobody knows. On one hand, market participants are concerned about the monetization of AI or the AI bubble, but on the other hand, the same participants consider AI to be the end of software." Needless to say, these are mutually exclusive events.
That said, like all disruption, JPMorgan believes that there will be winners and losers in the software space, but from the outside it is impossible to identify the winners.
Using a very simple 33% rule i.e. 33% of the companies are winners for equity and debt, 33% of the companies default, and the rest are basically zombie companies where the equity has negligible value, but the debt has value. This simple math implies $22bn of losses for the 30 BDC cohort, or an 11% reduction in cumulative net assets ($195bn to ~$172bn) and leverage increases to around ~1.0x for the group, from 0.86x as of 3Q’25. In such a scenariom. spreads will widen dramatically as a whole, and there will be winners and losers within the BDC universe as well.
As discussed in the JPM report, even if one takes a more draconian scenario, i.e. 75% of software exposure defaults, a name like OTF will see a material write-down in NAV, but because it is only levered 0.62x currently, it will exit at around 1x debt/equity. Not to say that JPM is recommending OTF, in fact the bank believes that its spreads will go wider... but the point is that some structures can handle significant strain because of low leverage (well, obviously: the question is what leverage is low and what are the cumulative losses and severities, i.e. distress 101). To a certain extent, JPM hopes the sector goes through this stress. These BDCs are a ‘show me’ story for credit analysts, PMs, traders, and rating agencies. And like the aircraft lessors, the BDCs need their Covid and Russia/Ukraine moment.
Well, if that's what JPM wants, it will get it because the BDC space is getting poleaxed right about now.

With that in mind let's take a closer look at who is most at risk from the ongoing Software rout.
First, the 30,000 foot view: the recurring nature of SaaS revenue, coupled with multiple expansion, has made the sector a darling for sponsors and private credit alike. While it is beyond the scope of this analysis to infer how the advent of AI will threaten SaaS companies and other cloud-based providers, in the table below JPM outlines exposure for the 30 BDCs that it track, as well as other metrics. As noted above, getting a complete software exposure is hard since firms categorize their portfolio companies in different buckets.
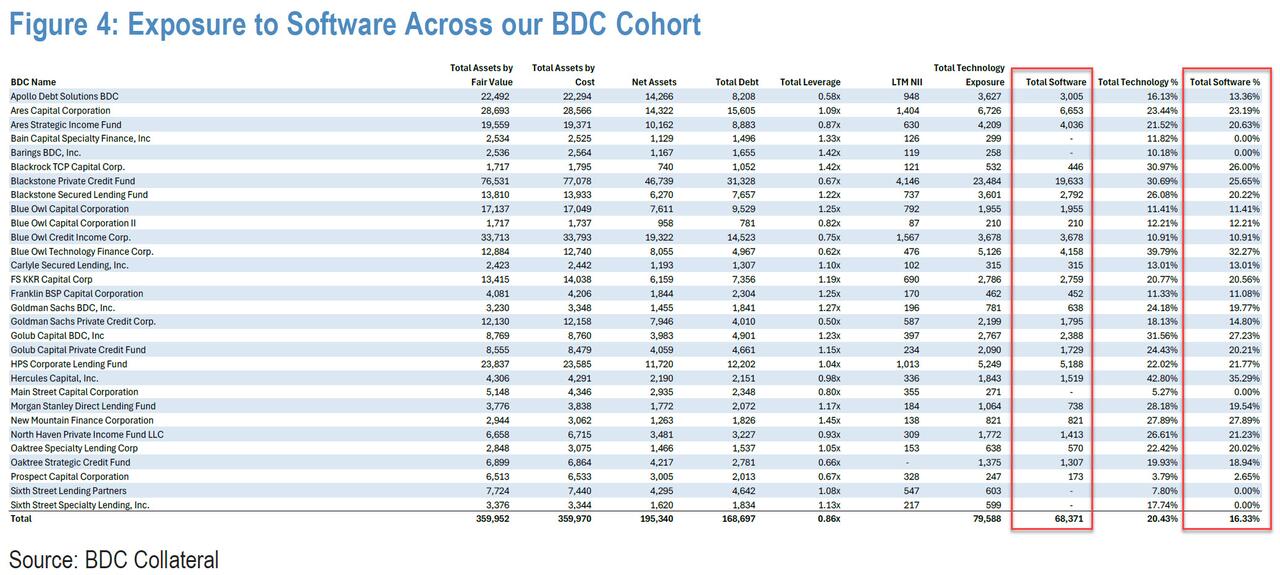
The table above highlights the software exposure across the landscape, but more importantly, it also outlines leverage and LTM net income since both are important when considering the impact to leverage in a stressed scenario.
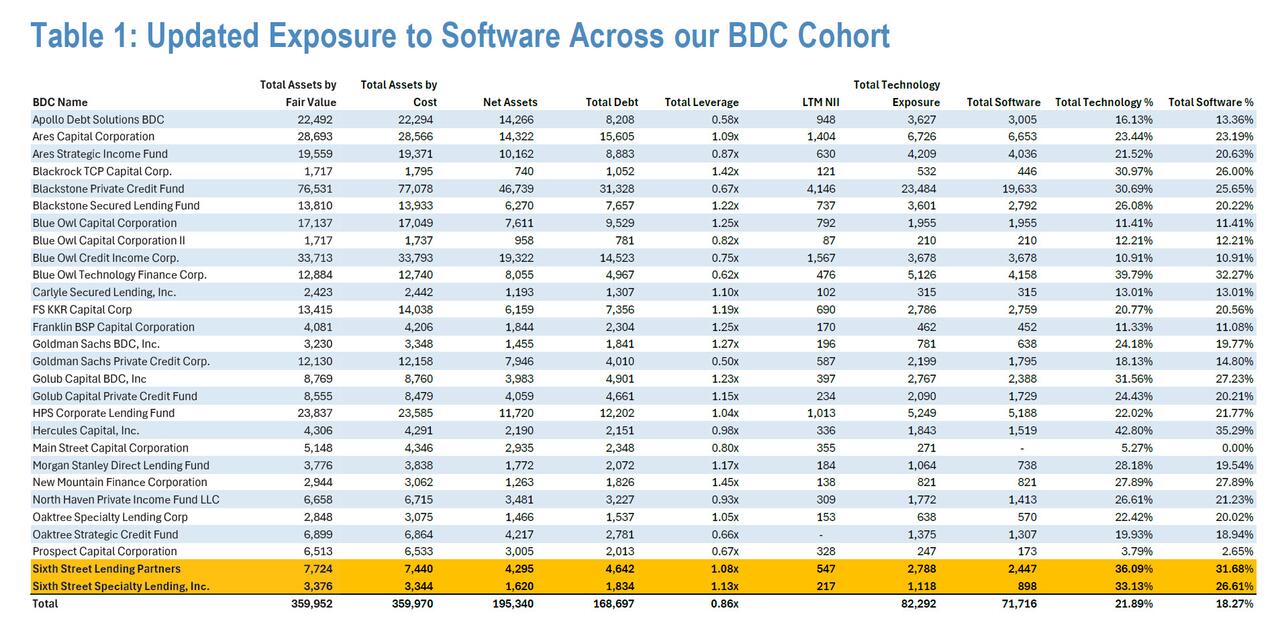
(As an aside, in a follow up report published by Caprihan this morning, he updated the table with software loans at the Sixth Street BDC: Software accounts for a whopping 31.68% of TSLX’s total portfolio at fair value and 26.61% of SIXSLP’s. Total software exposure increased by ~$3.2bn for the cohort when adding TSLX. The updated report can be found here).
JPM also highlights the top 10 software portfolio companies held across the 30 tracked BDCs. These exposures were found in the SOIs. The tables include the BDCs exposed to those names, marks across the BDCs, and the size of the exposure relative to each portfolio.

Medallia is a well known $1.8bn software loan across BDCs that is marked in the low 80s, but notably FSK has it marked above 90%. Most other large software loans are marked close to par, except for Auctane - a $1.3bn loan that is marked between 94% and 99% across holders.

The next chart shows the top 10 software positions as a % of total portfolio at fair value.

Of note: the analysis looked at the largest BDC holdings across the sector and did not focus on concentrated exposures within BDCs. For example, Discovery Education is the 9th largest software loan at BCRED with about ~$700mn, but it did not make the above list since it is only held at BCRED and BXSL and the total loan is less than the above cut-off. However, that loan is a PIK loan and is marked in the 80s, therefore it can have a material impact on BCRED. The point is that the above list is not exhaustive and there will be individual loans at all the BDCs that do not impact the sector but do impact the BDCs themselves. (In a future note, we will list all the top 10 exposures for BDCs and their marks).
BSL Software Exposure
Next, the JPM amalysts looked at the BSL market to analyze recent large declines in the software sector and to determine which BDCs have the largest exposure to these ‘stressed’ positions. This is only a subset of the BSL universe and accounts for only 25% of the software loans outstanding in the BSL market. The report identified six software loans that would be considered stressed, all of which have been marked down by 5pts over the recent months or weeks in the secondary market.
- The largest move was Cloudera, down ~13pts, which is held at NMFC and BCRED. Cloudera is marked at ~97 on average across both funds, but is currently priced at ~85. With that said, the Cloudera exposure is relatively small and only accounts for 0.1% of NMFC and BCRED’s total portfolio at fair value.
- The largest stressed exposure is Cornerstone OnDemand, which is held across six BDCs and on average represents 0.4% of their total portfolios - with a total market value of ~$365mn. The Blue Owl structure in particular has ~1% exposure to Cornerstone. Cornerstone OnDemand TLB 1L has fallen ~10pts since November 2025, now trading at ~83. And yet, the average mark across BDC holders was 97, as of 3Q’25.
- Another broadly held exposure is Finastra, owned across 9 of the 30 BDCs tracked, with an average exposure of 0.2% of the total portfolio across the 9 BDCs - with a total market value of ~$361mn. The average mark across the 9 BDCs was 101, compared to 88, where it is trading today. The loan has declined ~10pts in the past three weeks.


Stressing Software Books
JPM ran a variety of different scenarios for its stress test, from 75% losses on the software book over 3 years, a 30% default rate & 45% recovery over 3 years to the most draconian, a 75% default rate with a 10% recovery so a 67.5% cumulative loss rate. The bank was quick to stress - no pun intended - that these are stress tests in isolation; the analysis only looked at defaults on the software book.
A 75% default rate and 10% recovery assumption for a 67.5% cumulative loss over a single year with no accretion from NII is the most severe scenario that could be modeled. A couple of methodology clarifications: JPM is working with 3Q’25 leverage metrics (not ideal since leverage increased in 4Q’25), and assume total debt remains the same (also a very conservative assumption), did not factor in any benefit from imbedded equity gains (conservative assumption), and are essentially looking at starting leverage and ending leverage. JPM, which is clearly terrified of spooking various BDCs it would find as insolvent and who just happen to be the bank's clients, also cautions that it does not note that the starting leverage for some of the private, perpetual structures is very low (APODS at 0.50x, GSCRED at 0.50x and OAKSCF at 0.66x).
As the table below highlights, even in this scenario, most BDCs remain below 2x, some are above 1.5x, and those that are entering with low leverage are able to navigate it. This table reinforces JPM's favorable view for APODS and SIXSLP. OTF was the most insightful, while it was exposed to technology and software, it has little leverage. The end result: nearly $50 billion in cumulative net losses just across the tracked universe, and a 24% dilution in book value!
Draconian Scenarios - 75% Default, 10% Recovery in 1yr.

A more optimistic scenario is one where losses are incurred over a 2-5 year time period, which implies that management is able to adjust, delever, and grow the capital base. In the scenario below JPM projects out different loss rates over a 3 year time frame and also assumes that 10% of NII is retained by the BDC. It does not assume that NII drops since the debt number is kept constant, and thus it is fair to assume that NII remains unchanged. The scenarios are illustrative, and highlight the ability of these BDC structures to withstand significant losses, at least until more cockroaches emerge.

Scenario 1: 75% Cumulative Default Rate and 10% Recovery over a 3yr period

Scenario 2: 50% Cumulative Default Rate with 25% Recovery

Scenario 3: 30% Cumulative Default Rate with a 45% Recovery Rate

Scenario 4. 10% Cumulative Default Rate and 60% Recovery

Much more in the full JPM report available to pro subs. Additionally, here are a few other must read reports for pro subscribers (here, here and here).