Bullion Bank: How to (Implicitly) Book Silver Gains
Contents (1800 words)
- Relative Value in Precious Metals: Gold Versus Silver
- Silver: Geopolitics, Liquidity, and Speculation
- Gold: Structural Demand Remains Intact
- Emerging Divergence in Forward Outlook
- Trade Expression: Relative Value via the Ratio
- Final Comment
- Final Final Comment
Introduction: A Record Worth Revisiting
In September 2024, Goldman Sachs recommended that clients buy silver modestly. On January 12, 2025, the bank reiterated that recommendation with a more aggressive conviction. Since then, Goldman Sachs has remained largely quiet on silver.1
Now, the firm is effectively reframing the trade. Silver is described as overbought, while gold is presented as undervalued on a relative value basis.
No bank is perfect. Any trader with experience carries sufficient scar tissue to prove that. This is not an easy acknowledgment to make; But it was Goldman Sachs that correctly identified the structural change in the gold market as early as 2022.
It was Goldman Sachs that issued a buy recommendation on gold when much of the market in 2023 argued:
“The USD correlation says gold should go back down.”
And it was Goldman Sachs’ Lina Thomas who maintained that position when other banks reversed course and challenged the thesis. 2
That historical context does not grant immunity from error. But it does establish why this latest relative value framework between gold and silver deserves careful attention.
What follows is a structured attempt to express the evolving precious-metals regime through a relative value lens. We will add some final comments at the end of our breakdown as well below.
With that context established, the current trade is framed through the gold to silver ratio (ZeroHedge), where silver’s speculative extension contrasts with gold’s structural accumulation profile.
Relative Value in Precious Metals: Gold Versus Silver
Context: A Ratio at Multi-Year Extremes
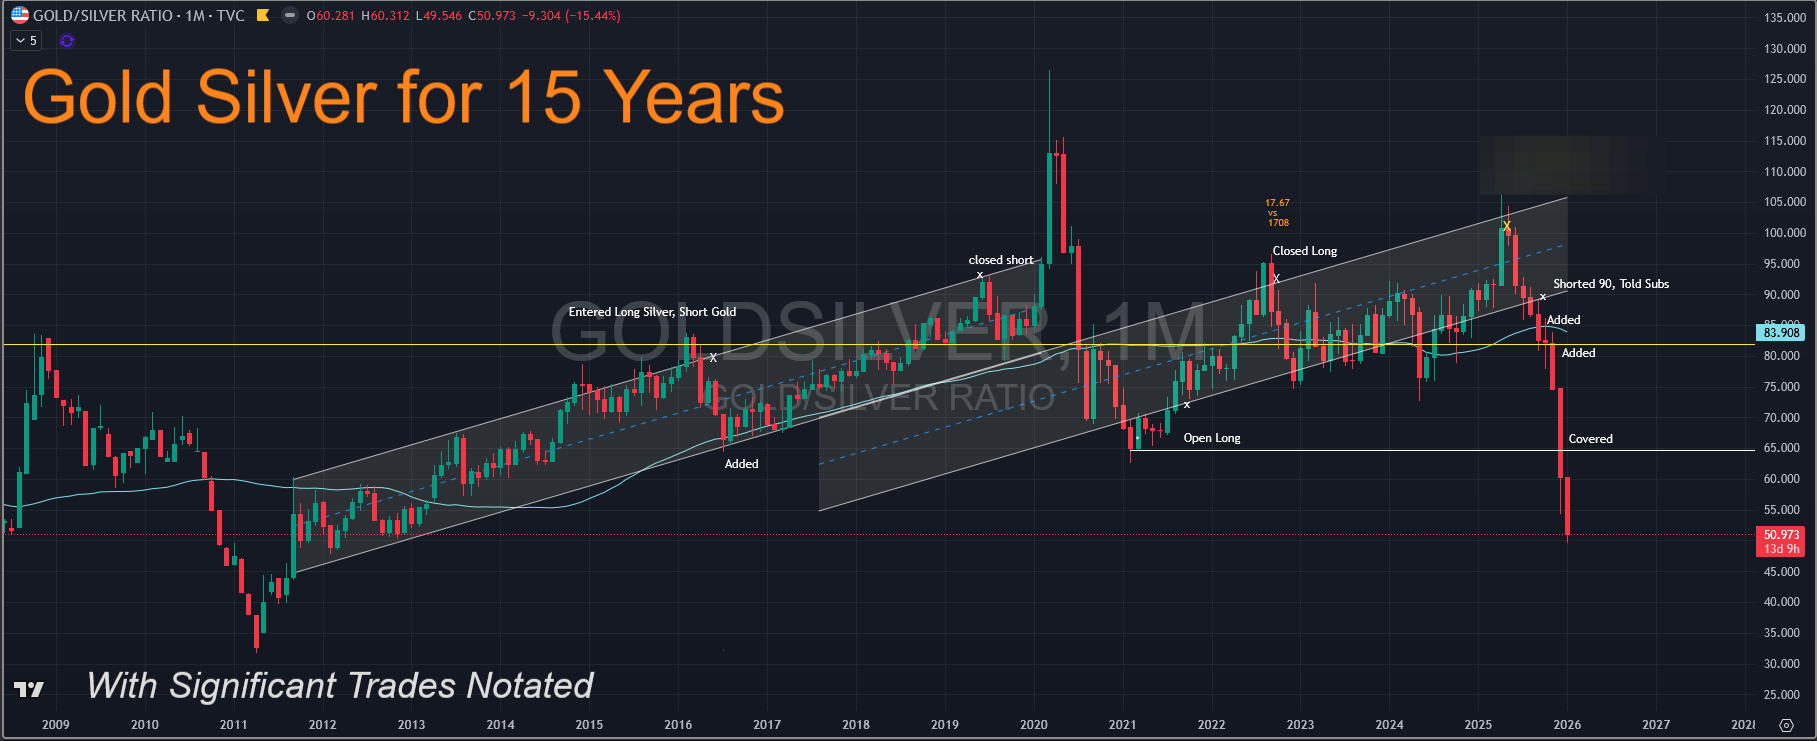
The gold to silver ratio has fallen to twelve-year lows following an aggressive silver rally in the fourth quarter of 2025 that has extended into early 2026. Silver reached an all-time high of $92.20 per ounce on January 14.
This compression reflects silver’s sharp outperformance rather than a deterioration in gold fundamentals. Gold itself delivered a 67 percent gain in 2025, maintaining its role as a primary diversification asset.
[GSR Since 2009 With Trades]
Attribution and Source Framework
The analysis is authored by Augustin Magnien, Catherine Downie, and Georgii Piskov of Goldman Sachs. The report frames the current precious-metals environment as a convergence of geopolitical supply constraints, investor positioning, and structural demand asymmetries between gold and silver.
Silver: Geopolitics, Liquidity, and Speculation
Silver now sits at the intersection of trade policy and industrial concentration risk. The United States recently classified silver as a critical mineral. China, which controls approximately 60 to 70 percent of global silver refining capacity (and 85% of the Solar Silver Value Chain), reduced the number of approved exporters.
These developments contributed to rising investor interest and accelerating price momentum.
[ Silver Investor Positioning vs Price]
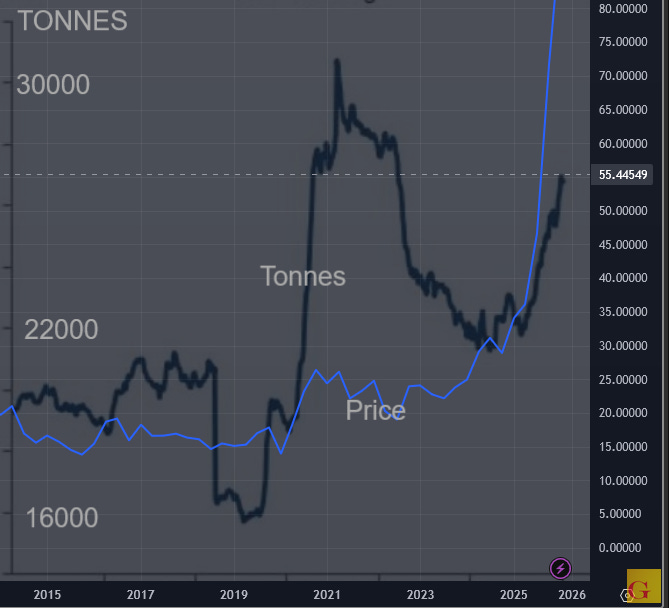
The move intensified as London inventories tightened. Market participants pre-positioned metal in the United States in anticipation of potential tariffs on silver imports of up to 50 percent. This pre-positioning reduced available liquidity in London and amplified price sensitivity.
“Extreme price action is likely to persist on thin London inventories.”
Gold: Structural Demand Remains Intact
Despite the ratio compression, gold’s performance remains supported by structural demand. Gold continues to function as the preferred vehicle for diversification away from the U.S. dollar.
Gold ETF holdings represent only 0.17 percent of non-cash U.S. financial portfolios, below the 2012 peak. This indicates that allocation expansion remains possible.
Central bank demand further reinforces gold’s position. Reported official purchases are forecast to average 70 tons per month in 2026, compared with a pre-2022 average of 17 tons per month.
[Central Bank Gold Purchases, Monthly Average ]
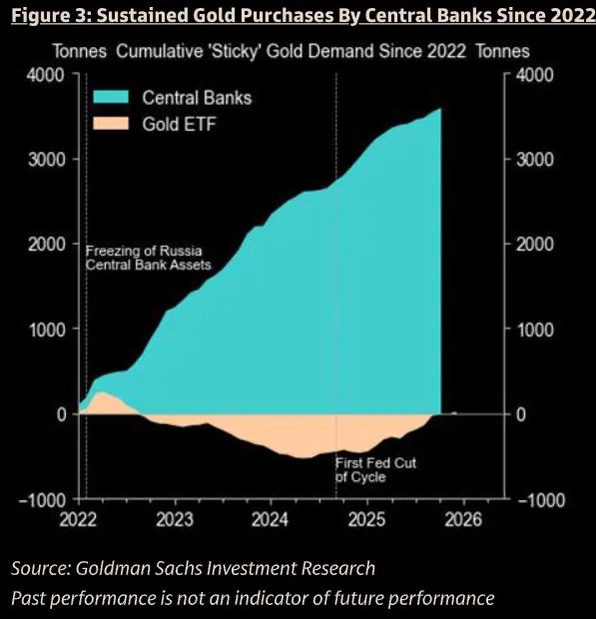
“Central bank buying remained resilient even during highly volatile periods.”
Continues here