Feb 4 Market Summary: After The Sharp Sell-Off, Where It Goes Next
From the TightSpreads Substack.
Data from Morgan Stanley
Today’s market action was a high-dispersion momentum shock with modest headline index moves masking violent internal rotation: crowded momentum/AI longs got crushed while laggards rallied sharply. The S&P 500 closed down 0.51% at 6,882.72 (down 35.09 points, lowest in two weeks after intraday lows near 6,839), the Nasdaq Composite fell 1.51% to 22,904.58 (down 350.61 points, heaviest tech/semiconductor pressure), the Dow Jones Industrial Average rose 0.53% to 49,501.30 (up 260.31 points, supported by mega-cap defensives like Amgen), and the Russell 2000 edged modestly positive or flat in some prints. This mixed close reflects capital fleeing expensive growth/momentum names into cheaper cyclicals, financials, and defensives.
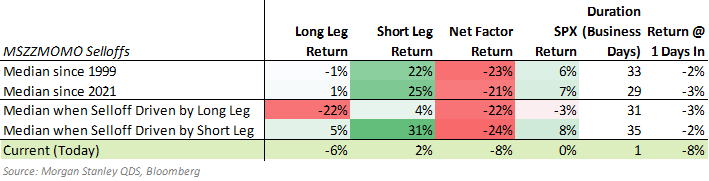
The defining feature was an extreme momentum reversal—the MSZZMOMO basket plunged 7.7% (-4 z-score), its worst single-day drawdown in roughly three years. Almost all the pain came from aggressive trimming of year-to-date winners (long leg MSQQUMOL -5.7%, -2.5 z-score), not shorts covering (short leg MSQQUMOS +1.9%, +1 z-score). Weakness concentrated in crowded high-beta themes: AI beneficiaries (MSXXAIB -6.5%), AI Power (MSXXAIPW -6.7%), National Security, Bitcoin Miners, and other high-momentum pockets (e.g., MSXXCRWD proxy -1%). Single-stock hits were heavy in NVDA, TSLA, AMD, MU, PLTR, and MSTR. Laggards rallied sharply across nearly every sector, creating a “contra-AI” flip: Early Cycle Cyclicals (MSXXECYC +3.5%), Chemicals, Regional Banks (KRE +1.56%), and select mega-cap defensives outperformed as capital rotated out of consensus trades.
This bar chart shows today’s volume much higher than average across sectors (pink = current, blue = 20-day avg). High bars mean lots of trading—real money rotating out of momentum/AI into cyclicals/banks. Elevated volume confirms conviction in the shift.

The move stemmed from crowded positioning meeting an air pocket in demand—no marginal buyer emerged to absorb selling pressure from hedge funds (HFs) and other institutions reducing exposure to high-conviction themes. Retail (individual investors) avoided aggressive dip-buying until the afternoon bounce, ending with net demand in the 16th percentile of the past year—far below average. Institutions showed early cash equity selling (supply in the 11th percentile), with partial futures recovery (demand in the 65th percentile). This left themes like AI (MSXXAI), National Security (MSXXNSEC), Rare Earths (MSXXRMAT), and Retail Favorites (MSXXRFLO) exposed. High short interest stocks (MSXXSHRT) lagged sharply (-1 z-score move), and breadth remained narrow, confirming concentrated long reductions.
Estimated intraday flows illustrate the dynamic: institutional cash outflows dominated early (green line dipping), retail inflows lagged until later (orange line rising modestly), and futures provided some late support. The lack of balanced buying amplified velocity in momentum-sensitive names.

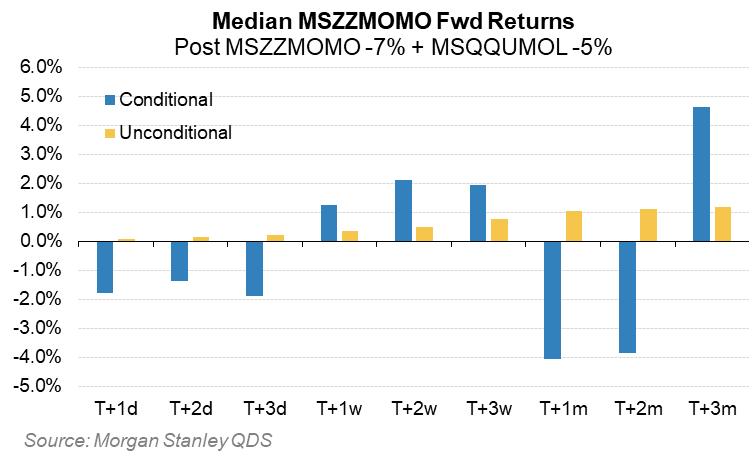
Today’s market saw a big, one-sided drop in the Morgan Stanley Long/Short Momentum pair (MSZZZMOMO) — it fell 7.7% in a single day.
The pair is made of two legs:
-
Long equity leg = buy the hottest, highest-momentum stocks (MSQQUMOL)
-
Short equity leg = sell/short the weakest, lowest-momentum stocks (MSQQUMOS)
Today the long side (hot stocks) crashed hard -5.7%, while the short side (weak stocks) only rose a little +1.9%. So the momentum strategy — which bets that winners keep winning — got hit badly because the winners suddenly stopped winning.
Historically (only ~10 similar big one-day drops since 2000 where the long leg fell ≥5%), these moments have usually been bearish short-term for the momentum pair:
-
Next few days to 1-2 months → median returns negative (often -1% to -4%)
-
By 3 months out → turns positive again
The chart shows this pattern:
-
Blue bars = what happened after these rare big drops (small sample, so noisy)
-
Yellow bars = normal/average days for comparison
-
Short-term blue bars are mostly negative → momentum spreads tend to keep struggling a bit longer
-
Longer-term (T+3m) blue bar jumps positive → eventual rebound/recovery
Big momentum-long breakdowns like today often signal near-term pain for momentum strategies, but the effect fades and can reverse over a few months.
Extreme crowding in global semiconductors accelerated contagion: HF net exposure reached 16% of total global books (100th percentile since 2016, 99th over last 12 months), with YTD dollar buying in semis >5× any other industry, roughly half of all 2025 semis demand, and exceeding any non-semi industry’s full-year demand in 2025. This overcrowding explains why an AMD-related shock spread rapidly across AI/tech themes.

Retail Favorites (MSXXRFLO) fell -11% in the prior week (now only +2% YTD after +14% through late January), reflecting 84th-percentile overlap with momentum since 2017. Retail demand has historically faded into Tax Day (mid-April) due to liquidity drains from tax payments; January strength correlates negatively (~-34%) with February-March returns, often producing reversion as inflows slow post-strong January. Estimated rolling 1-week retail demand patterns show the typical seasonal decline approaching Tax Day, with 2026 tracking historical precedent closely; today’s subdued buying (16th percentile) fits fading support.


Momentum tenor overlap heightens vulnerability: 38 names appear in all four long momentum baskets (1m, 3m, 6m, 12m), near historic highs (>35 threshold). In prior episodes (sample of 9), subsequent 1-3 month returns for long momentum were negative. The largest overlapping names are semis-related, concentrating risk.
Cross-asset crowding adds pressure: HF exposure to Metals & Mining neared 86th percentile since 2010; retail cumulative net flows exceeded $20bn into GLD/SLV over the past year (accelerating until recently). MSXXRFLO now holds ~7 such stocks (double 2017-2024 average), while MSZZMOMO carries net +11% industry exposure (11% of long leg, 0% short leg).


Mechanical supply intensified the move: levered ETF rebalancing generated ~$13bn in US equity supply (top 50 largest days ever), heavily concentrated in NDX/tech/semis with outsized single-name flows (> $100mm each in TSLA, NVDA, MU, PLTR, AMD, IREN). Levered ETFs maintain constant leverage by buying/selling underlying assets mechanically as prices change, often exacerbating intraday declines during momentum breaks.

QUICK NOTE ON JANUARY CPI*
January is usually one of the hardest months to predict for inflation because so many things happen at the same time, and this year a government shutdown is adding even more confusion and uncertainty. Core inflation (which excludes volatile food and energy prices) almost always speeds up a bit in January—this is a normal, well-known pattern in the data. Many companies raise prices right after the holiday season when new budgets, contracts, and catalogs kick in. Even after the government applies seasonal adjustments to smooth out predictable patterns, the January core CPI number (month-over-month) still tends to come in higher than in other months. Historical data shows January core CPI averages about 5 basis points (0.05%) above the underlying trend (the 3-month moving average from October–December of the prior year). This regular January bump often surprises forecasters slightly—the print typically ends up just 2 basis points above Bloomberg consensus on average. So yes, January core CPI will almost certainly be higher than December purely because of this seasonality, but the big question is how large the increase will be.
Three extra factors this year could make the jump bigger or smaller:
-
How quickly any new or existing tariffs pass through into consumer prices,
-
Noise or disruptions caused by the government shutdown (which can mess with data collection or economic activity), and
-
Possible changes to the way seasonal adjustments are calculated.
Significance for markets
A larger-than-expected January core CPI print—even if mostly seasonal—can reignite fears of sticky inflation, pushing bond yields higher and pressuring rate-sensitive equities (growth/tech, small-caps, cyclicals). If the acceleration is modest and clearly seasonal, markets often shrug it off. Shutdown noise increases the risk of misinterpretation and volatility around the release; tariff effects could add persistent upside to core goods inflation, disproportionately hitting import-exposed sectors (retail, consumer discretionary, industrials). In a long/short book, this setup warrants caution on long-duration/growth names ahead of the print and relative longs in inflation-resilient or value/cyclical pockets if the surprise is contained.
