2/20/26 Market Wrap: Cautiously Grinding Higher
From the TightSpreads Substack.
Overall weekly performance
US equities closed the week higher: the S&P 500 (SPX) gained +1.07%, the Nasdaq-100 (NDX) rose +1.13%, and the Russell 2000 small-cap index (IWM) added +0.6%. This was a broadening risk-on week where money rotated into both high-growth tech names and economically sensitive cyclicals, even while geopolitical headlines and mixed earnings kept things choppy.
What drove the gains
The Magnificent 7 basket (MSXXMAG7) led with a strong +2.3% weekly gain. Amazon (AMZN) jumped +5.7% after bullish AWS commentary, Apple (AAPL) rose +3.4%, and Google (GOOGL) gained +3% on the Gemini 3.1 Pro rollout. NVDA (+3.8%) and META (+2.5%) also contributed after news of their strategic partnership. Consumer stocks (MSXXRTL) rebounded +1.7% on tariff-relief hopes. Industrials were a standout: Transports rose +3% and Modern Defense (MSXXDRON) surged +6%, helping small caps (IWM) hold up. Energy and Financials also participated positively. When big tech leaders deliver positive news and cyclicals (industrials, energy, defense) join in, it shows the market is broadening beyond just the “hot” names. This is healthy rotation — money spreading out instead of piling into the same seven stocks.
Friday’s key event
On Friday the Supreme Court struck down President Trump’s global tariffs, sending the SPX up +0.7% for the day. Markets liked the removal of tariff uncertainty, especially for consumer and import-heavy names. Tariffs raise costs for companies that import goods. Removing them is like taking a weight off — consumer and discretionary stocks breathe easier, which is why we saw relief in those areas.
The bigger picture underneath the surface
Even though the indexes rose modestly week-over-week, the S&P 500 has stayed range-bound for the month. This is because of high cross-sectional dispersion and low correlation: individual stocks are moving a lot (1-month single-name realized volatility is in the 91st percentile since 2005), but the overall index is calm (SPX realized vol only in the 58th percentile). Dispersion means stocks are not all moving together — some are up big, some are down big. Low correlation means they’re not dragging each other in the same direction. This makes the index look stable even while a lot is happening underneath. More on this toward the end.
Options & gamma mechanics
Dealers (the big banks/market makers) are now long a significant amount of gamma on the upside (~$30 billion in a 1-2% rally). This acts like a headwind for further upside in the index because dealers sell into rallies to stay hedged. On the downside, that long-gamma cushion fades quickly. Gamma is how fast a dealer’s hedging changes as the market moves. Long gamma on the upside means dealers sell as the market rises (capping rallies). It’s a mechanical brake on big upside moves right now. More on this toward the end.
Positioning snapshot (from MS Prime Brokerage data as of Thursday EOD)
-
US L/S hedge fund net leverage is 53% (right at the 1-year median).
-
Gross leverage is still very high at 211% (97th percentile since 2010) — funds are running big books on both sides.
-
Macro systematic strategies (CTAs, vol-control, risk-parity) have reduced net equity leverage to the 44th 1-year / 65th 5-year percentile — they are less likely to cause big forced selling on modest moves.
-
Momentum crowding remains elevated: 38 names now appear in all four momentum tenors (1m, 3m, 6m, 12m). Historically, when overlap is this high (>35 names), long momentum tends to underperform over the next 1-3 months.
-
Hedge funds remain heavily exposed to Momentum, Low Quality, and Small-caps.
Retail flows
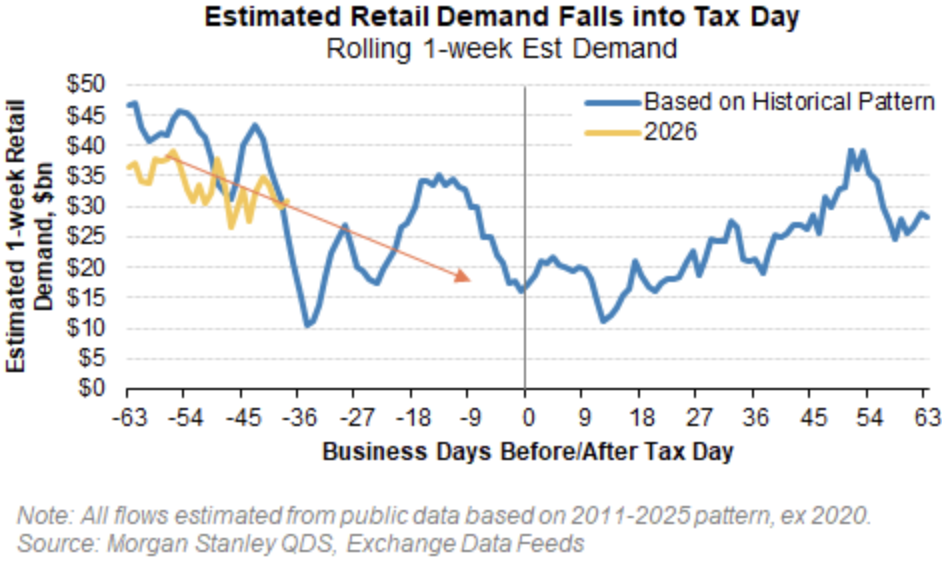
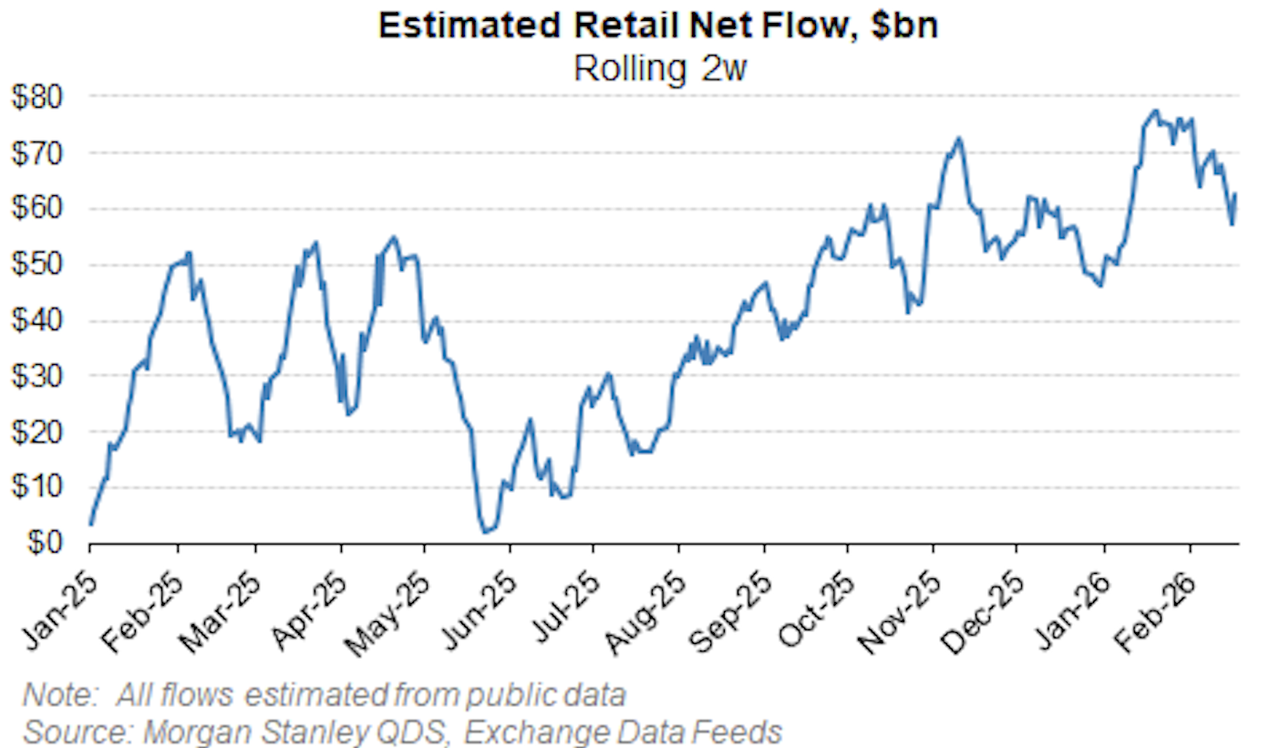
Retail was a net buyer of ~$23 billion last week (53rd 1-year percentile), but the bid has clearly moderated: 2-week net buying eased to ~$60 billion. Retail investors were a huge buying force in January, peaking near $80 billion. Retail now accounts for only 8% of market volume (9th 10-year percentile). Since the buying has slowed coupled with Tax Day coming in mid-April, we could see even more selling for tax payments. Since retail favorites overlap heavily with momentum names, any further slowdown could pressure those high-beta stocks. YTD retail has net bought ~$60bn of Tech single names and $25bn in Discretionary single names, making them the two most net bought sectors YTD.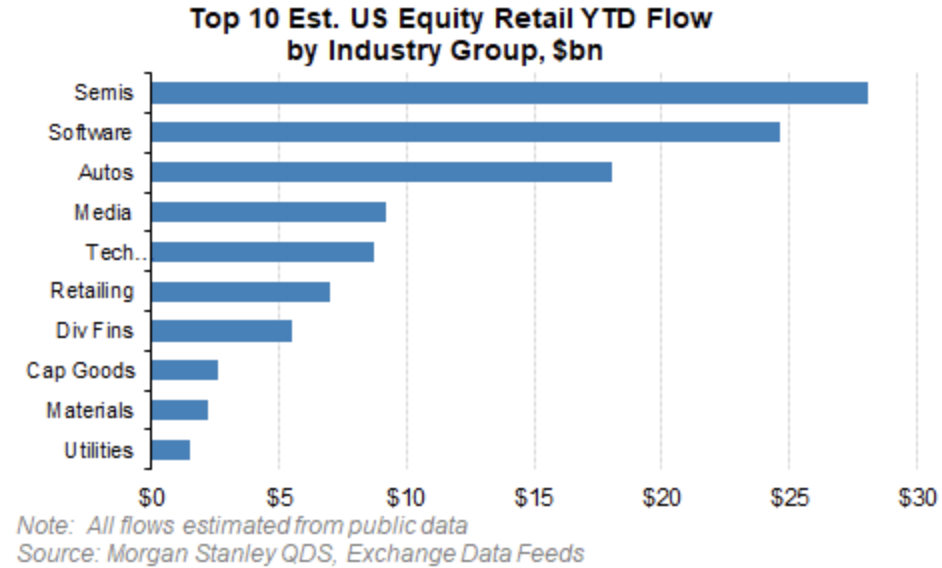
Buyback & ETF flows
Corporate buybacks remain solid — February is historically one of the most active months, and daily notionals are +15% week-over-week. Financials and Software dominate the flow. 60% of Buyback flow currently consists of 10b5-1 plans as 10b-18 repurchases continue to ramp up. ATM and corporate cross-selling remains quiet. Flows continue to be dominated by the Financial and Software sectors.
ETF flows were mixed: Energy (+$1.0bn), Industrials (+$1.2bn), and Real Estate (+$460mm) saw inflows; Health Care (-$800mm) and Financials (-$1.1bn) saw outflows. Rates ETFs had big inflows ($9.1bn).
Expanded: Model Driven Flows, Options Positioning, and Implied Volatility
Pensions and large asset allocators (think large retirement funds and endowments that manage money for millions of people) are estimated to buy roughly $15 billion of US equities into month-end. This is strong buying — it ranks in the 87th percentile of the last 5 years. They do this because they have strict rules: at the end of every month they must rebalance back to their target weights. Right now they are selling international stocks (developed markets -$17bn and emerging markets -$4bn, very low percentile levels) and using that money to buy more US stocks. This is pure mechanical demand that often supports the market late in the month, regardless of news.
On the other side, the big systematic macro strategies — these are huge computer-driven funds such as CTAs (trend-following), volatility-control funds, and risk-parity portfolios — have brought their net equity leverage down to the 44th percentile over the last year and 65th percentile over 5 years. Because they are now less levered than usual, QDS expects them to sell another $15–20 billion of global equities over the next week, with most of that selling in North America. These funds don’t care about headlines; they follow strict rules based on momentum or volatility targets, so when the market weakens they automatically sell more — this is classic mechanical supply that can add downside pressure if we see any further softness.
The overall Street (option dealers plus levered ETFs) is currently net short gamma by about -$6 to -$7 billion per 1% move in the S&P 500. Breaking it down simply: option dealers are long $2–3 billion of gamma per 1% (they buy dips and sell rallies to stay hedged, which normally calms the market), but levered ETFs are short $8 billion of gamma per 1% move. The ETF short gamma wins, so the street as a whole is net short gamma. Importantly, dealers are still meaningfully long gamma on the upside because of the way volatility is supplied in the market — this acts like a mechanical brake that can dampen or cap any further 1–2% rally in the index (dealers sell as prices rise to stay neutral).
Finally, we are seeing very high cross-sectional dispersion. One-month S&P 500 dispersion is in the 92nd percentile since 2005. This means individual stocks are moving very differently from each other right now. As a result, even though single-stock realized volatility is extremely elevated (91st percentile since 2005), the overall S&P 500 index realized volatility remains relatively subdued (only 58th percentile). High dispersion and low correlation between stocks is why the index can look calm while a lot of chaos is happening underneath in individual names.
What this means
Pension rebalancing gives us a reliable mechanical bid into month-end — a supportive technical tailwind. However, systematic selling (~$15–20bn next week) and net short gamma create fragile upside: rallies can stall mechanically, especially above 1–2%. High dispersion favors stock-picking over broad index or sector beta. Watch month-end flows closely — if pension buying dominates systematic selling we could see a grind higher; if systematic flows dominate, downside risk increases quickly.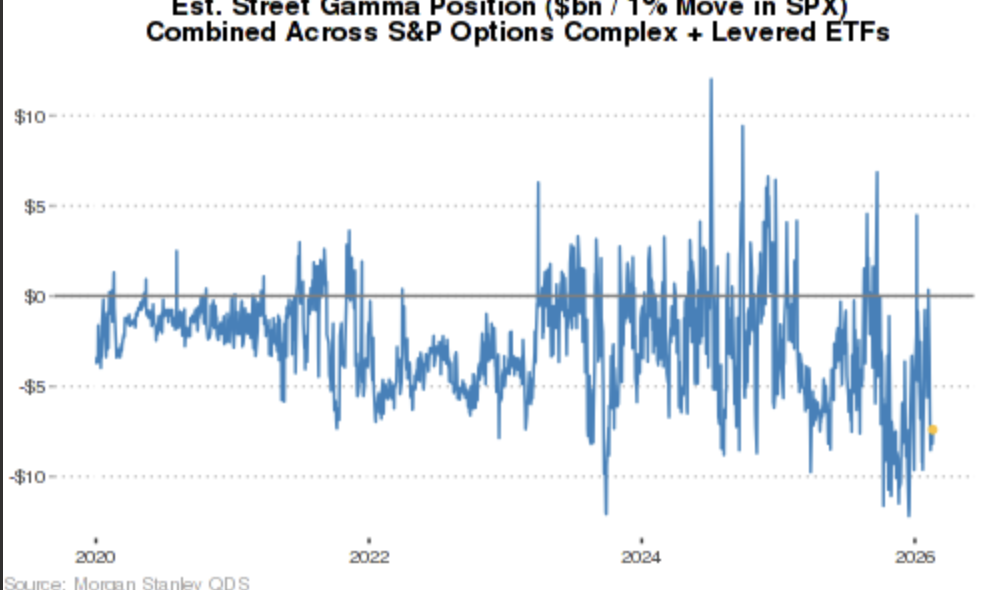


I’m remaining cautiously long on the rotation (industrials, defense, energy, select cyclicals, consumer post-tariff relief). I’m constructive on the AI theme, but the market is expressing favorability in momentum shorts and hedging momentum longs more thoughtfully. Especially amidst private credit concerns. Be cautious chasing NDX strength — gamma and positioning suggest limited follow-through on the upside. And to note, NVDA earnings are on 2/25. Historically when HFs have increased exposed to Semis into NVDA earnings as they are now, NVDA and the broader Semi complex have seen profit-taking into the print, though that weakness has tended to be short-lived with a bounce post-earnings. As I mentioned above, the near-term the tape has balanced but fragile flows: ~$15–20bn systematic selling risk is roughly offset by ~$15bn pension buying and steady buybacks, but the directional pressure is tilted against crowded momentum/high-beta names and toward cyclicals, industrials, energy, and defense. Retail slowdown into Tax Day and high hedge fund gross leverage mean any volatility spike could quickly tilt the balance toward more selling.
Overall, the tape is constructive but not euphoric. We have room for more rotation if retail and systematic flows stay orderly, but any acceleration in de-grossing or retail selling into Tax Day could flip the momentum quickly.
