Continues here
Oil Could Peak at $170 in 6 Months
Bernstein Energy: How high can oil price go?
Authored by GoldFix
TL;DR
-
Supply shocks dominate near-term oil dynamics: Bernstein frames the market as highly sensitive to geopolitical disruptions, where even modest supply losses trigger outsized price responses due to already tight balances and low spare capacity.
-
Inventories are the key transmission mechanism: OECD stock levels act as the buffer; when inventories draw down, price elasticity collapses and accelerates the move toward spike conditions.
-
Endgame is demand destruction and macro drag: Sustained high prices ultimately force consumption adjustment, feeding into slower global growth and reinforcing a cyclical reset in energy markets.
Framing the Shock: Oil Risk as a Function of Duration
The report centers on a single controlling variable: time. Oil is already repricing higher, but the terminal level depends entirely on how long the Strait of Hormuz remains impaired.
“How high oil price goes is dependent on the duration to which the Strait of Hormuz is shut down.”
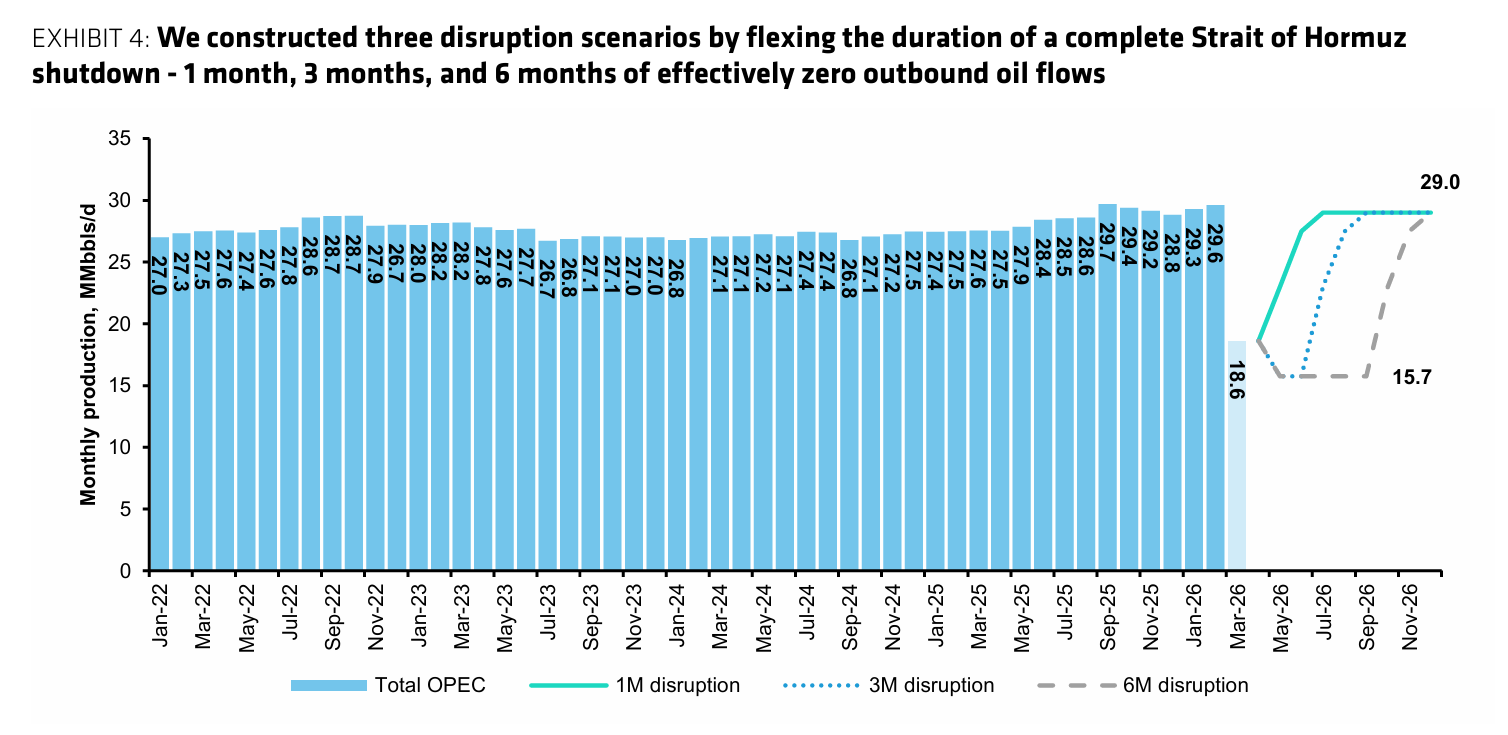
Bernstein analysts asked “How high can oil price go?” (Neil Beveridge et al.) and construct three scenarios: 1-month, 3-month, and 6-month disruptions. This temporal framework replaces traditional supply-demand equilibrium modeling with a duration-of-dislocation model, where price becomes a lagging variable to logistics failure.
Supply Shock: A System Operating Through a Chokepoint
The report quantifies the scale of disruption with unusual clarity. A full shutdown removes over 15 million barrels per day, combining crude, condensates, and LPG flows.
“We see the potential for 15MMb/d of supply disruption in a full SoH shut down case.”
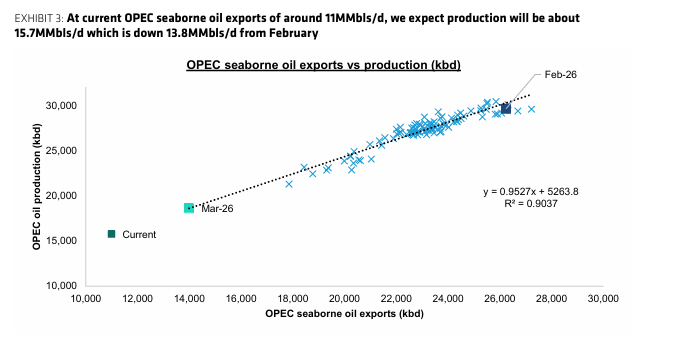
This represents a system-level interruption at one of the most concentrated energy arteries globally. Page 3 reinforces this through real-time export tracking, showing OPEC seaborne flows collapsing from roughly 25MMb/d to around 11MMb/d.
The structure here reframes oil as throughput constrained by geography. Production capacity exists, but it cannot clear the system when transit is impaired.
Demand Response: Elasticity Through Destruction, Not Substitution
Demand does not rebalance through substitution in the short term. It contracts through destruction.
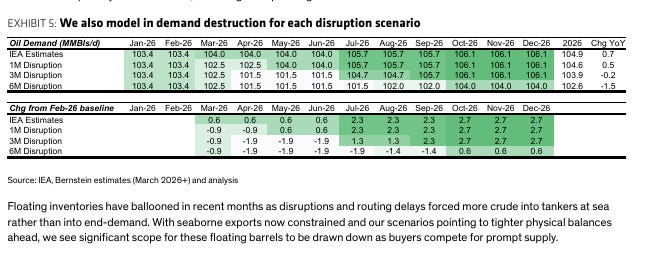
“Demand destruction could be in the range of 0.3–2.3MMb/d for 2026.”
The modeled demand decline scales with duration. A one-month disruption leads to modest impact, while a six-month disruption approaches crisis-level contraction comparable to 2008.
This implies that price becomes the mechanism of rationing. The longer the disruption persists, the more aggressive the rationing function becomes.
Inventory Illusion: Why Buffers Do Not Solve the Problem
Bernstein addresses floating storage and SPR releases, totaling roughly 550 million barrels of potential buffer.
“Liquidation of floating storage and SPR release… is still not enough.”
This is a time-shift mechanism rather than a solution. Inventories can smooth the path but cannot offset sustained structural supply loss.
Charts show OECD inventories drawing sharply across all disruption scenarios, with deeper and more prolonged declines in the 3M and 6M cases.
Price Formation: Inventory, Not Headlines, Drives the Curve
The report anchors oil pricing to the inverse relationship between inventories and price.
“OECD commercial inventories and oil prices move in opposite directions.”
This produces a structured price range:
- 1M disruption: ~$80 average, ~$100 peak
- 3M disruption: ~$100 average, ~$140 peak
- 6M disruption: ~$120 average, ~$170 peak
The mechanism is key. Price is derived from visible stock depletion and sustained draws, not solely geopolitical premium.
Free Posts To Your Mailbox
Contributor posts published on Zero Hedge do not necessarily represent the views and opinions of Zero Hedge, and are not selected, edited or screened by Zero Hedge editors.
Loading...