Oversold Conditions
Welcome to MktContext! I am a professional money manager, trader, and investor who has been timing and beating the market for over a decade. We specialize in predicting market direction by studying the economy and market signals. Join 12,000 subscribers at MktContext.com for our weekly deep dives and analysis!
At MktContext, we focus on timing the stock market. After deep selloffs, like the one just experienced YTD, we look for oversold indicators that tell us that stocks are due for a rebound. On Sunday, we wrote a note warning subscribers that indicators are severely oversold. Here is a sneak preview of that note.
Technical analysis - Oversold
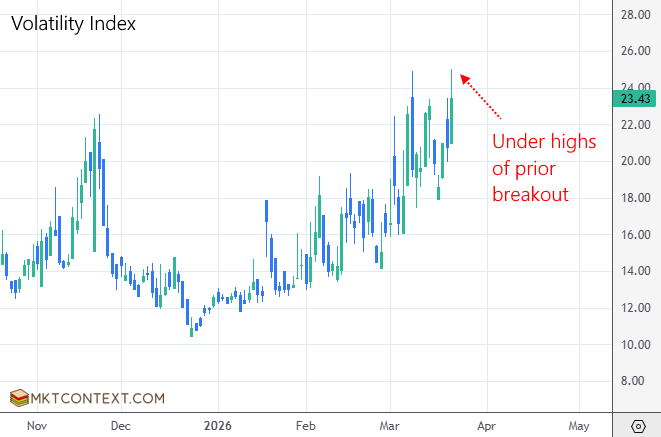
Even as SPX made new lows last week, the volatility index (using VOLI instead of VIX to remove the effects of Skew) has kept under the panic levels from earlier in March. This is a sign that fear is not escalating, and therefore selling pressure is not cascading.
Similarly, VIX term structure, which is also a gauge of fear, has actually normalized a bit since the sharp gap-up event two weeks ago.
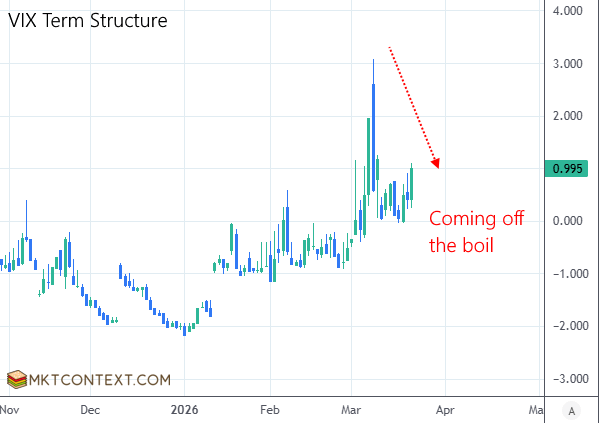
When VIX is elevated and term structure is inverted, as they are now, subsequent returns for equities tend to be positive. As volatility-sellers return to the market and depress VIX levels, this mechanically engages re-levering from systematic investors… potentially igniting a short squeeze.
Many of our equity market indicators are now flashing “oversold”:
-
Put/call ratio > 1
-
Stocks above 20-day average: 12%
-
SPX RSI < 30
-
Stocks making new lows: spiking
-
Selling volume in stocks: oversold
-
SPX futures positioning: oversold
-
Equity fund flows: large outflows
-
Fund manager cash levels: spiking
-
Forced liquidation in gold
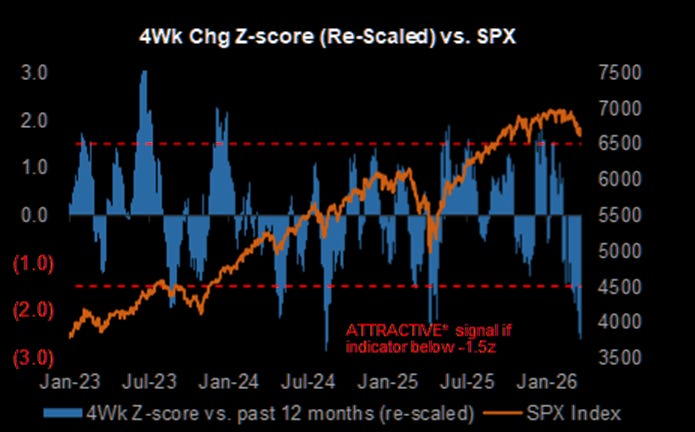
As shown above, equity positioning in the market is severely oversold.
Lastly, options expiry dates often act as major reversal points in SPX. A notable case was the March 2020 Covid selloff. In an unstable environment, market makers were forced to sell heading into Friday expiry. This dynamic happened this past Friday. Once those options expire, the selling pressure dissipates, leading to a V-shaped bounce.
For more market timing insights, subscribe for FREE at MktContext.com
Join 12,000+ macro investors who get these insights before the mainstream media catches on!