This Is The 3rd Largest Hedge Fund Selling In Over 10 Years
Are we there yet?
Here are the 11 relevant charts that we are looking at going into the weekend. Some of them (the first ones) indicate heavy capitulation. The others not so much.
Net leverage reduction
Hedge fund net flows are now close to one of the most bearish levels since 2018 (measured on a 3-month basis).
Source: JPM PI
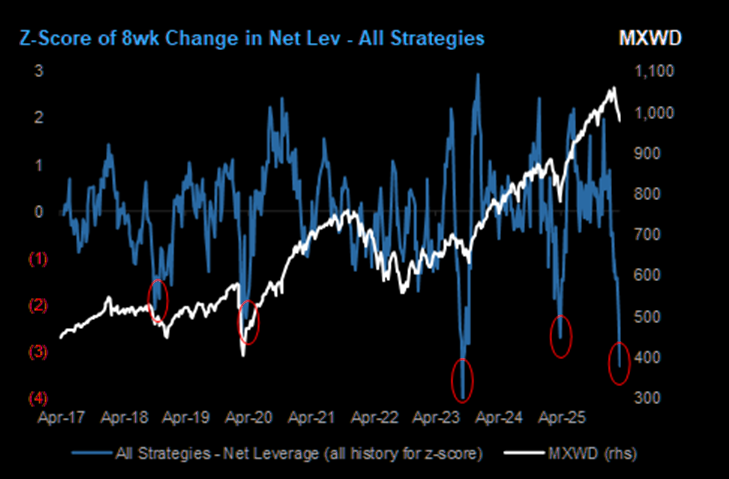
More on that net reduction
HF net leverage is now down almost 25% points from it’s 12m high, which makes this one of the largest drops in net that we’ve seen (8 week z-score of net lev change also at -3z recently).
Source: JPM PI
Third largest selling in 10 years
Some signs of capitulation are starting to emerge – on a trailing 6-week basis, the recent US net selling by hedge funds is the third largest over the past decade and approaching the levels seen in Apr-May ’20 during Covid and (to a lesser extent) into Liberation Day.
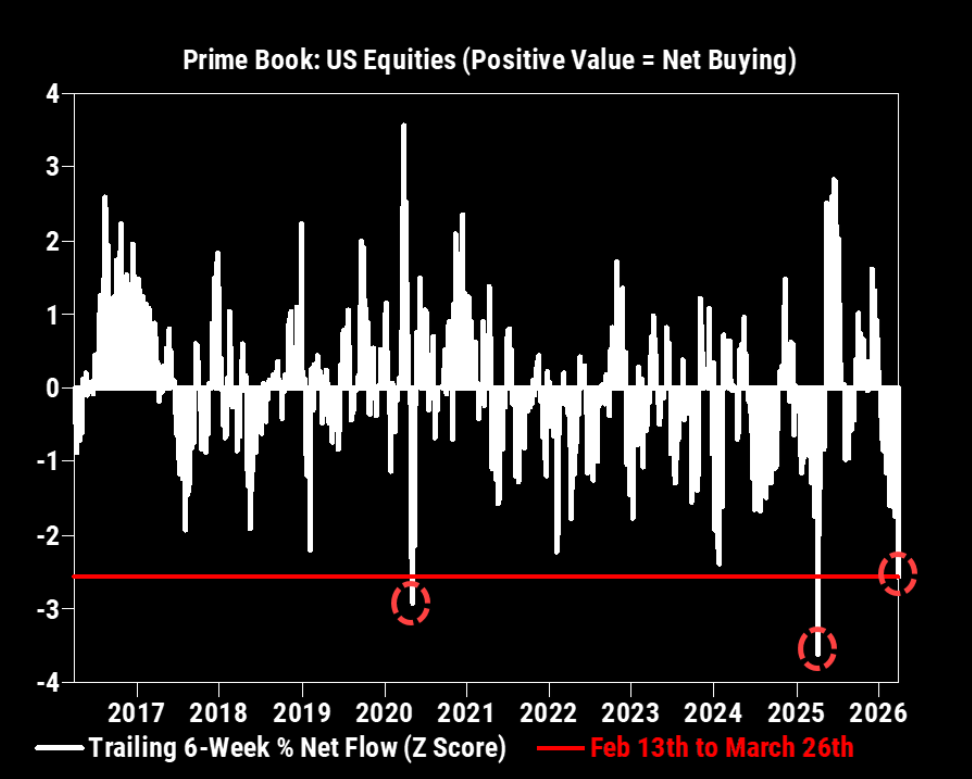
Source: GS Prime
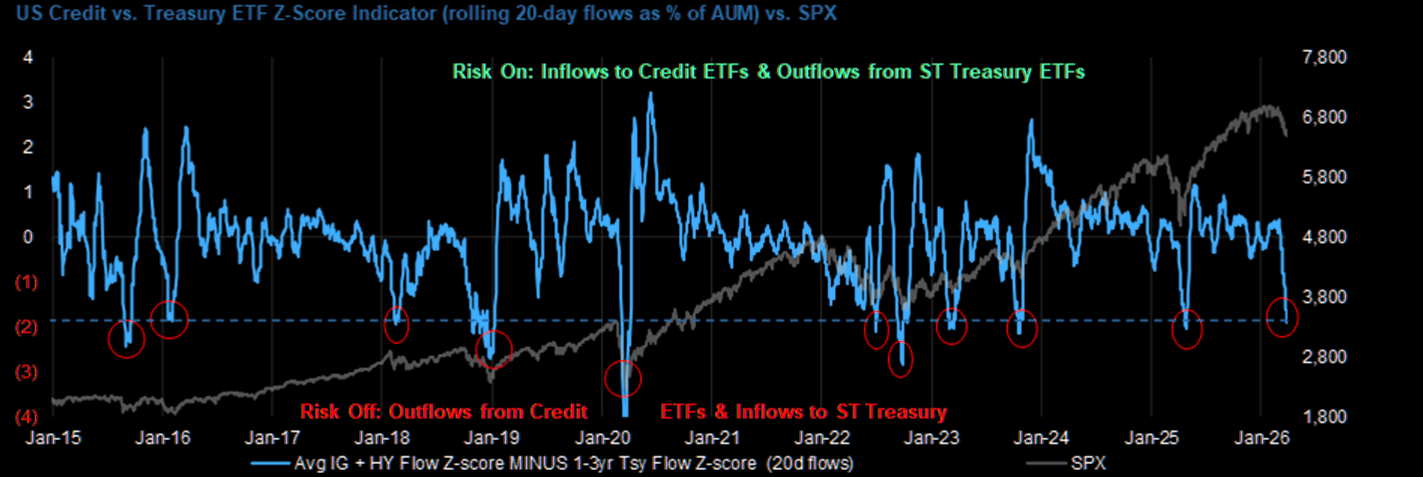
In credit too
The difference between net flows to US Credit ETFs and Short-Term Treasury ETFs is now one of the most negative of the past ~10 years.
Source: JPM PI
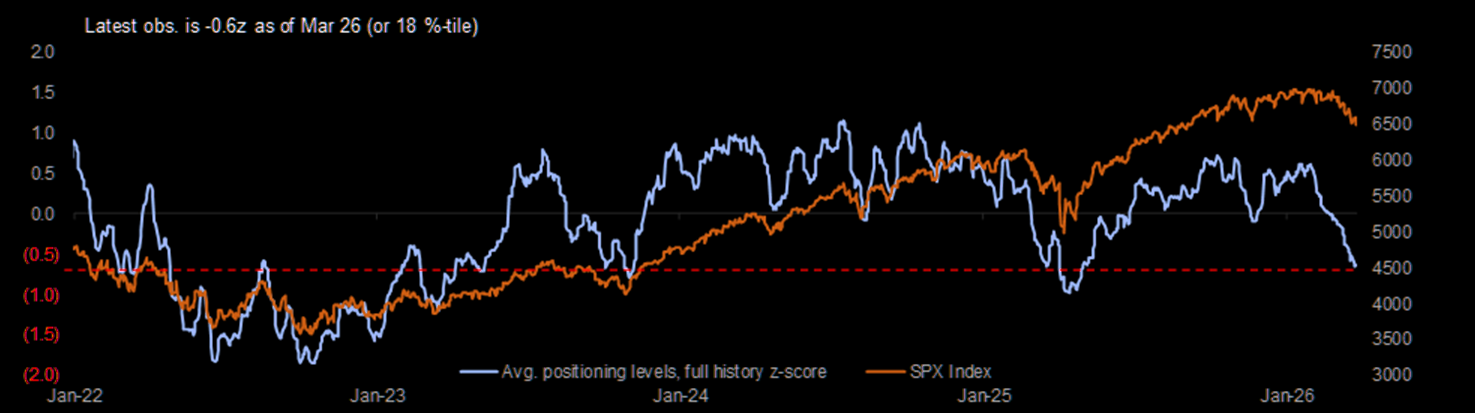
Closing in on Liberation Day
The level of overall positioning dipped slightly more to the 18th %-tile and is in line with mid-March ’25 levels (though still above early April lows).
Source: JPM PI
Selloff duration & frustration
"I think one reason many folks are frustrated with this selloff is because it isn't as sharp and 'buy the dip-like' as last year's. The one last year lasted 34 days. The current drop is already 42 days old, but the % decline is (so far) just less than half of last year's."
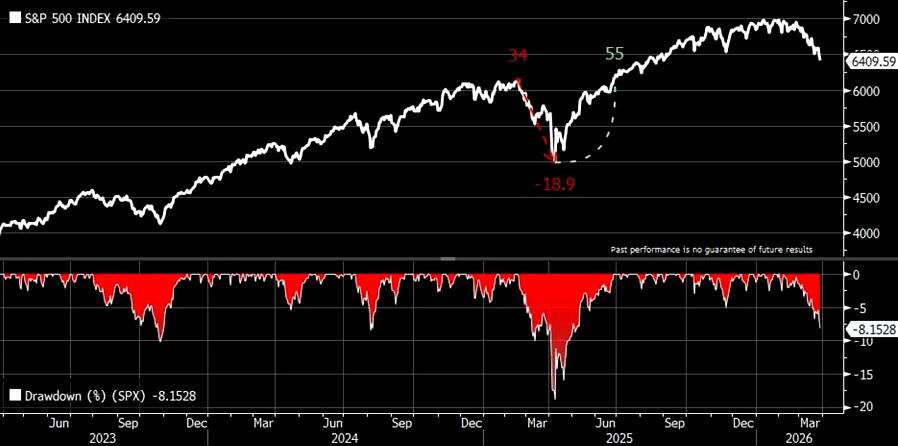
Source: @kevrgordon
Getting there
"This week our US Equity Sentiment Indicator dropped this week to -0.9, reflecting a large outright reduction in equity exposure. Sentiment Indicator levels below -1 have historically been predictive of above-average equity returns, although the signal improves when the indicator drops below -1.5."
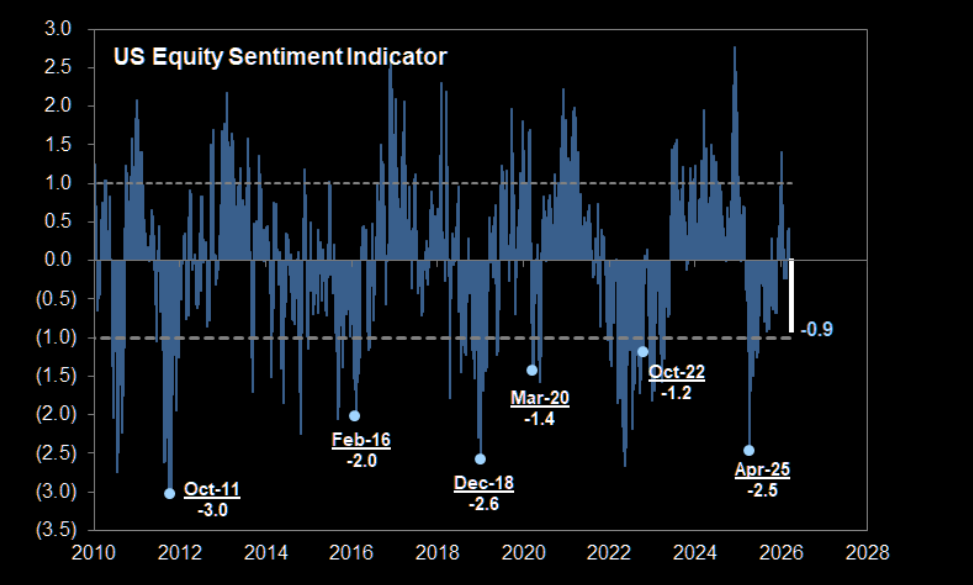
Source: Goldman
Outflows
Largest outflow from US equities in 13 weeks.
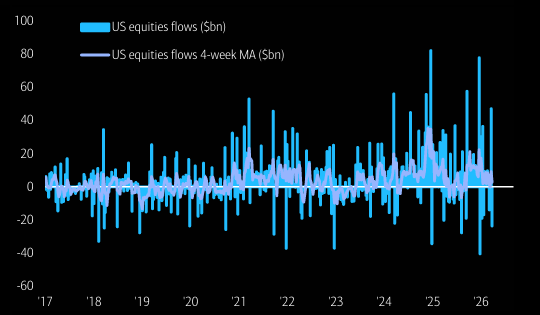
Source: Flow Show
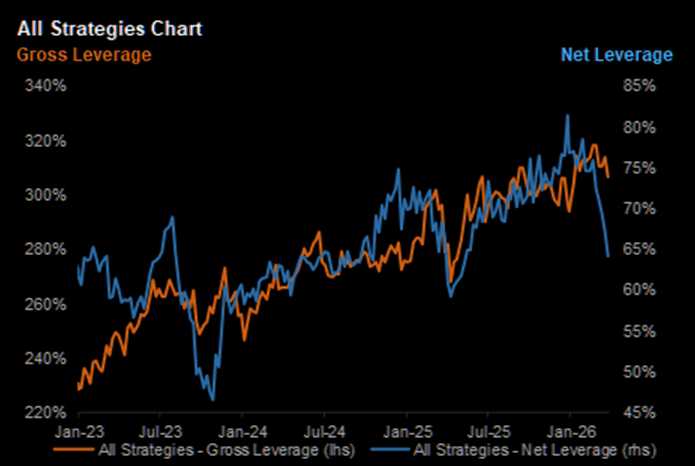
Hedge fund leverage
What stands out: Gross now finally coming down - have not seen these 1-year US percentile numbers in a long while. US net below 50% and at 13th 1-year percentile.
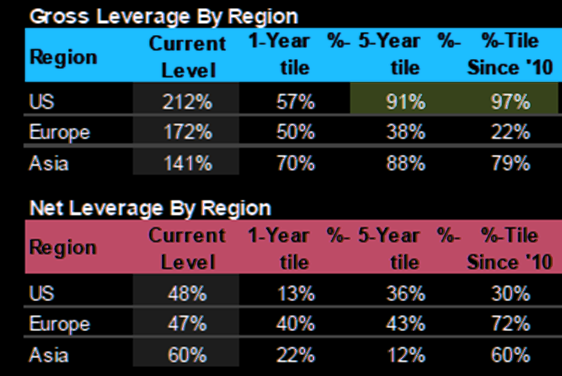
Source: MS Prime
Brutal consistent late-week action
9 straight negative Thursdays, 5 straight negative Fridays. Traders do not seem to want to be long over the weekend.
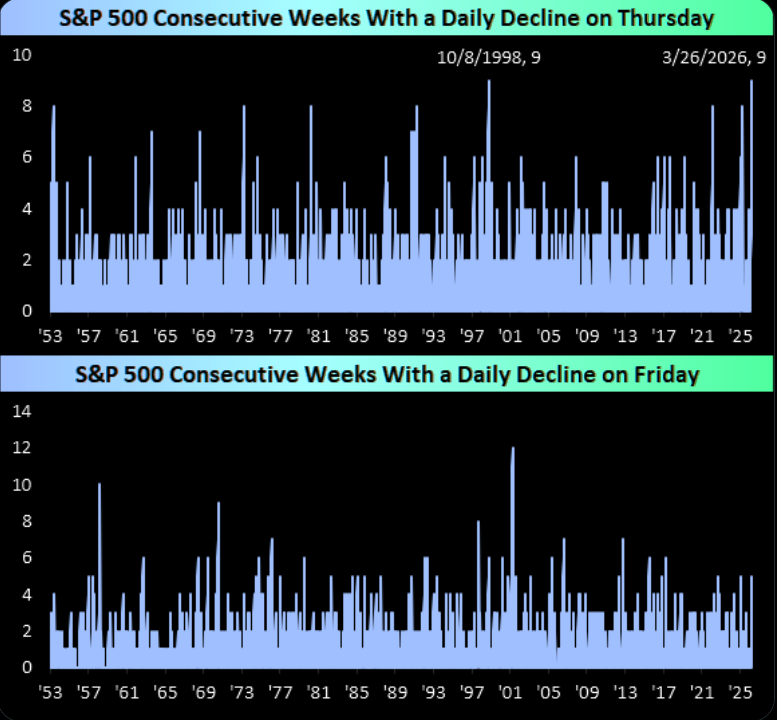
Source: Bespoke
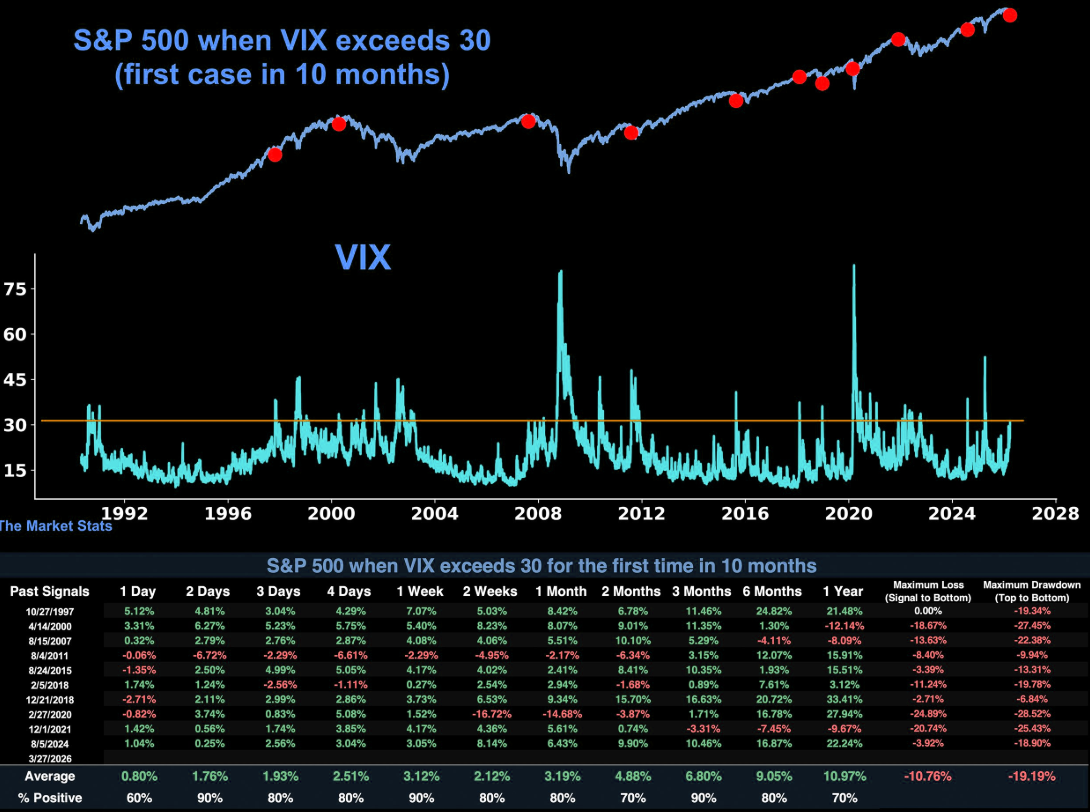
VIX > 30
VIX closed above 30 for the first time in over 10 months. Historically, SPX was higher 2 days & 3 months later in 9 of 10 cases. If this is a 2008, it will of course look completely different...