8 Charts Challenging the ‘Buy the Dip’ Narrative
Once a decade
Two Friday the 13ths in a row isn’t something you see often (once a decade!) – and judging by the tape last week, markets might be just a little superstitious too. During March 3rd - 10th, Asset Managers sold $36bn per Commitment of Traders, marking a 10+ year record in notional terms. There are plenty of contrarian extreme signals like this one that would indicate a tradeable low, but there are even more indicators that are far from extreme. Here are 8 charts that do not support the "must buy the dip as a contrarian" case.
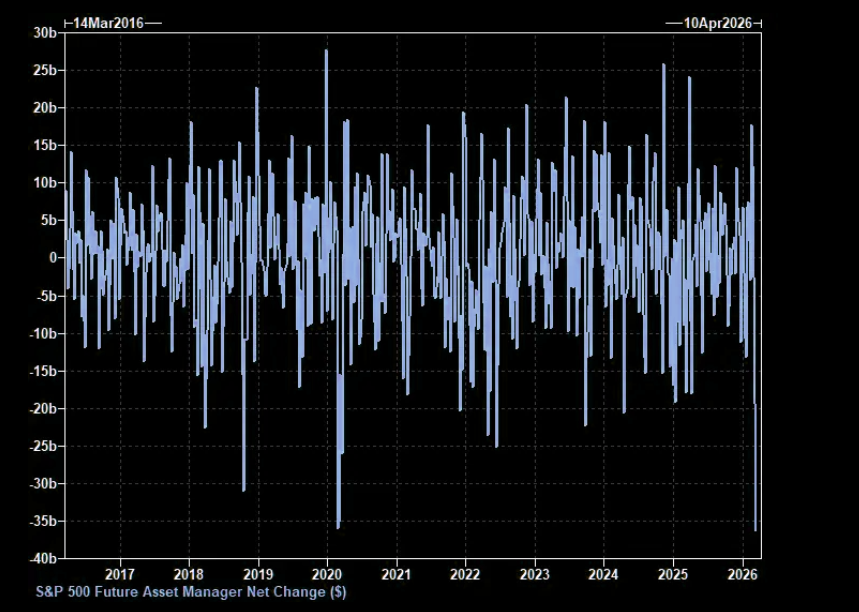
Source: GS trading desk
Just around neutral
Aggregate investor sentiment is close to neutral, S&P 500 RSI just slightly below neutral.
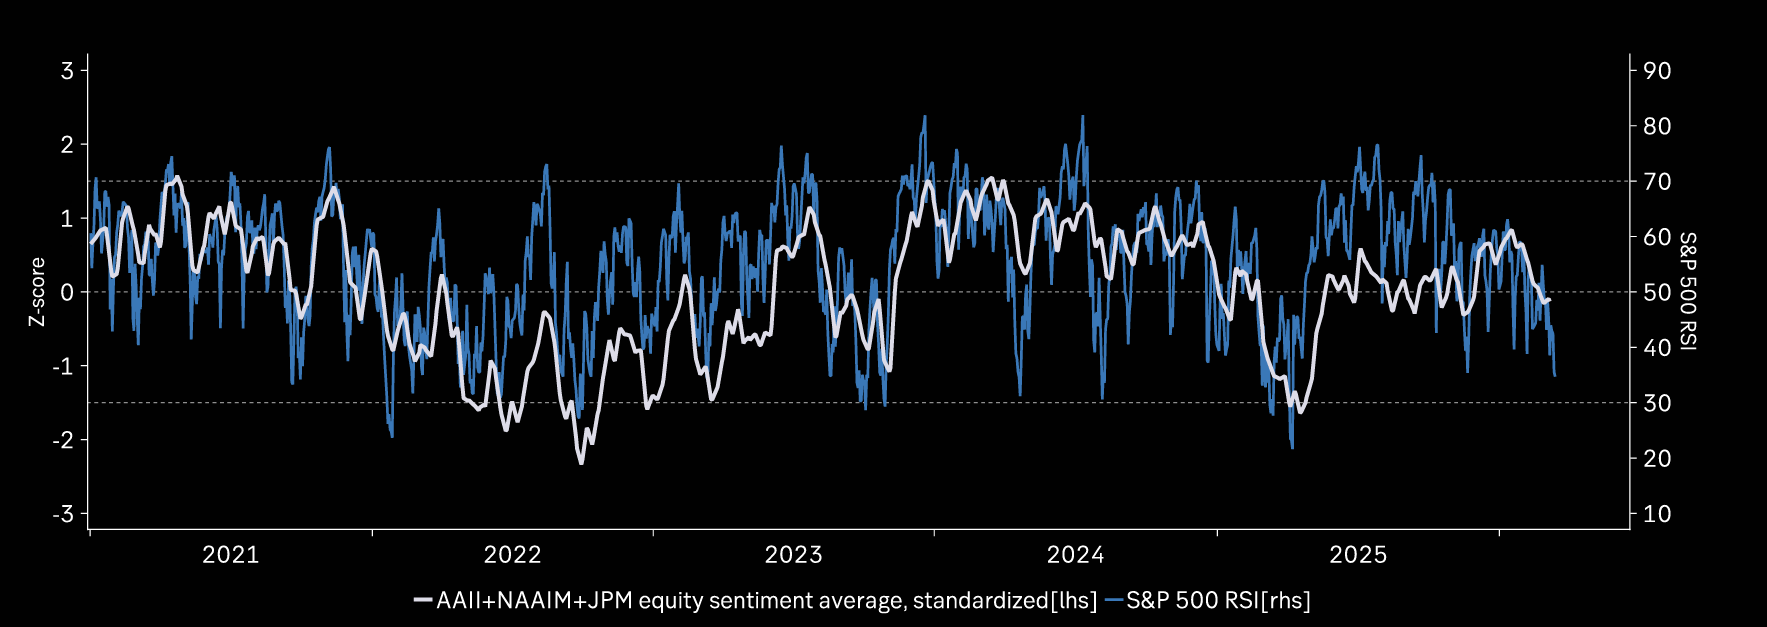
Source: Macrobond
Stuck at neutral
GS US Equity Sentiment Indicator of investor positioning that combines 9 measures of positioning across institutional, retail, and foreign investors is just at a neutral level.
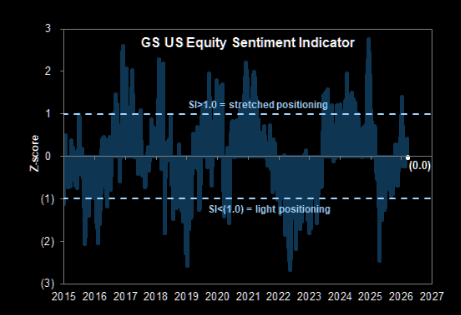
Source: Goldman
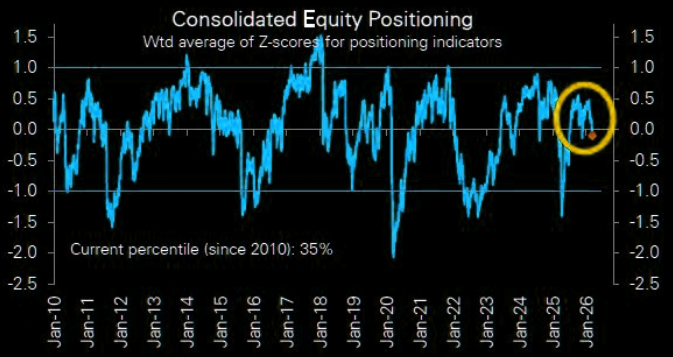
Just below neutral
The Deutsche Bank consolidated equity positioning indicator (long onlies, systematics and hedge funds) is just below neutral.
DB: "Our measure of aggregate equity positioning continued to drift lower and is below neutral (-0.10sd, 35th percentile from 38th percentile the prior week)."
Source: Deutsche Bank
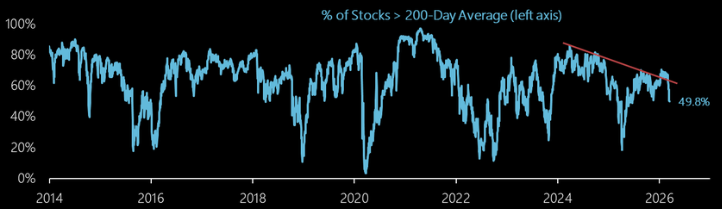
Many still above 200-day
Just about half of the stocks in the S&P 500 are still above their 200-day average. That does not sound like an extreme bottom.
Source: Hi Mount
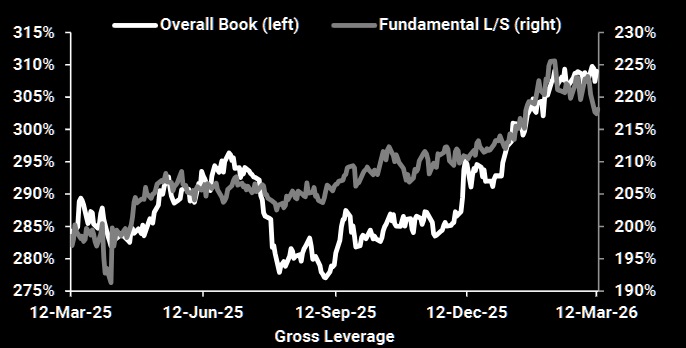
Gross up
Hedge funds actually grossed up last week.
GS Prime: "Overall book Gross leverage +3.6 pts to 311.0% (5-year high)"
Source: GS Prime
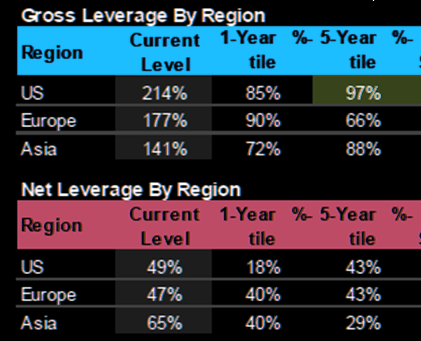
No de-grossing
Morgan Stanley sees gross exposure among US hedge funds at 97th percentile on a 5-year look-back.
Morgan Stanley Prime brokerage: "No hedge fund de-grossing despite the P&L pain."
Source: MS PB
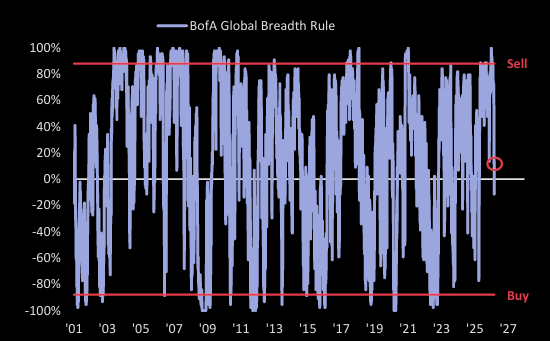
Not yet a buy
BofA Global Breadth Rule is not yet at “buy signal”.
Source: BofA Quant
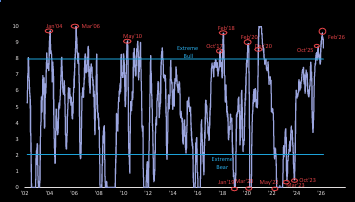
Actually a sell
Hartnett: "Our BofA Bull & Bear Indicator is at 8.7signal which is Sell"