Everybody Wrong
Everybody wrong
Morgan Stanley's Martijn Rats:
"The last few years have been a steady exercise in market humility. “Oil can’t go negative.” It did. “Russia will always be a reliable supplier of gas to Europe.” It wasn’t. “Hormuz is too important to actually stop.” Until it did."
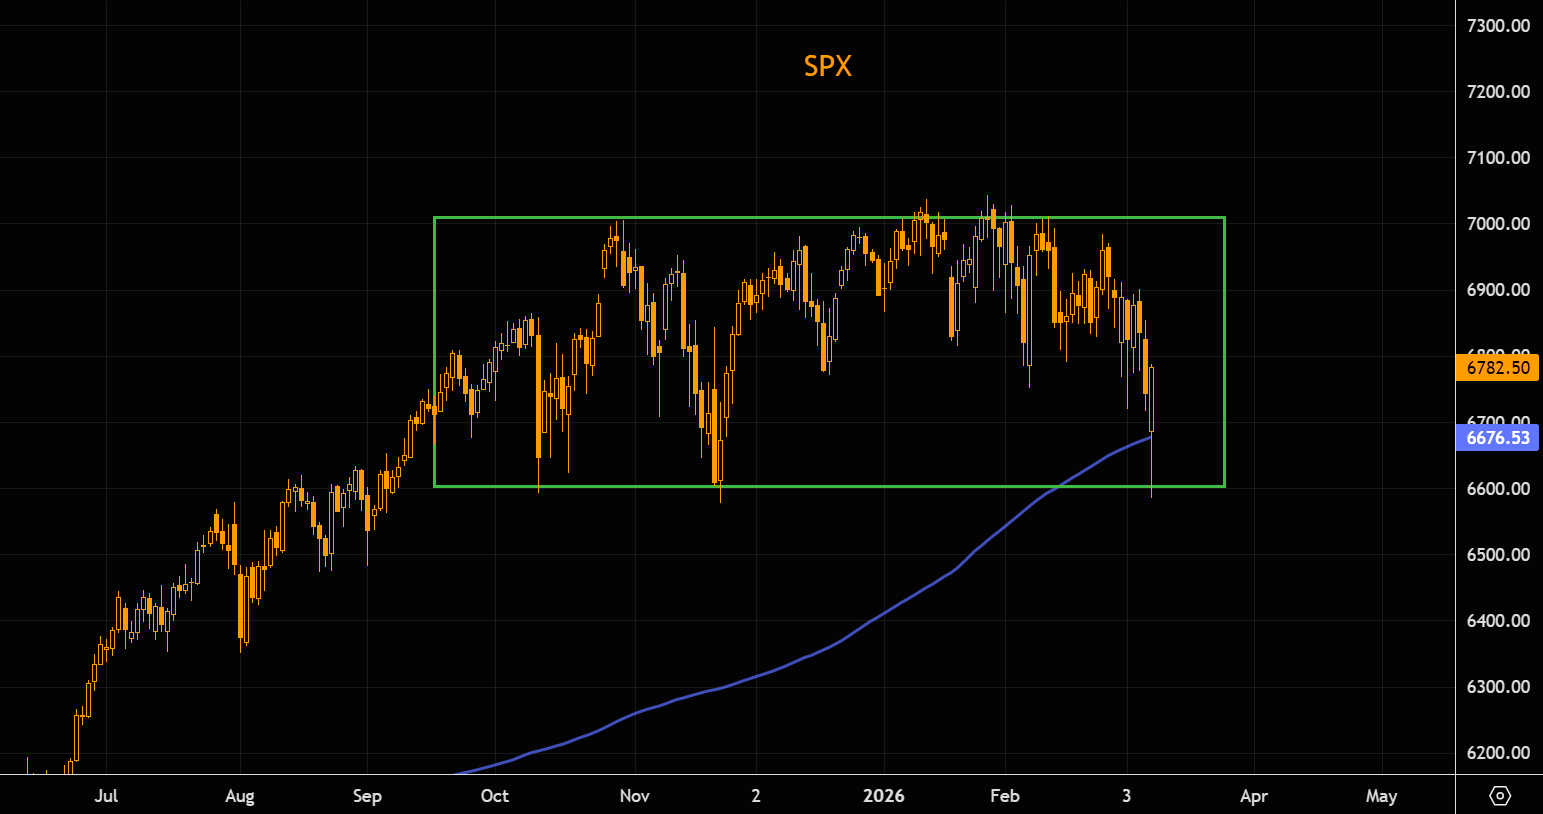
SPX
Quick update on the range logic we flagged earlier today when markets were deep in the red. SPX has printed a massive hammer candle, with intraday lows right at range support. The index is now well above the 200-day MA again. Headline risks remain large both ways, but for now the eternal range holds.
Source: LSEG Workspace
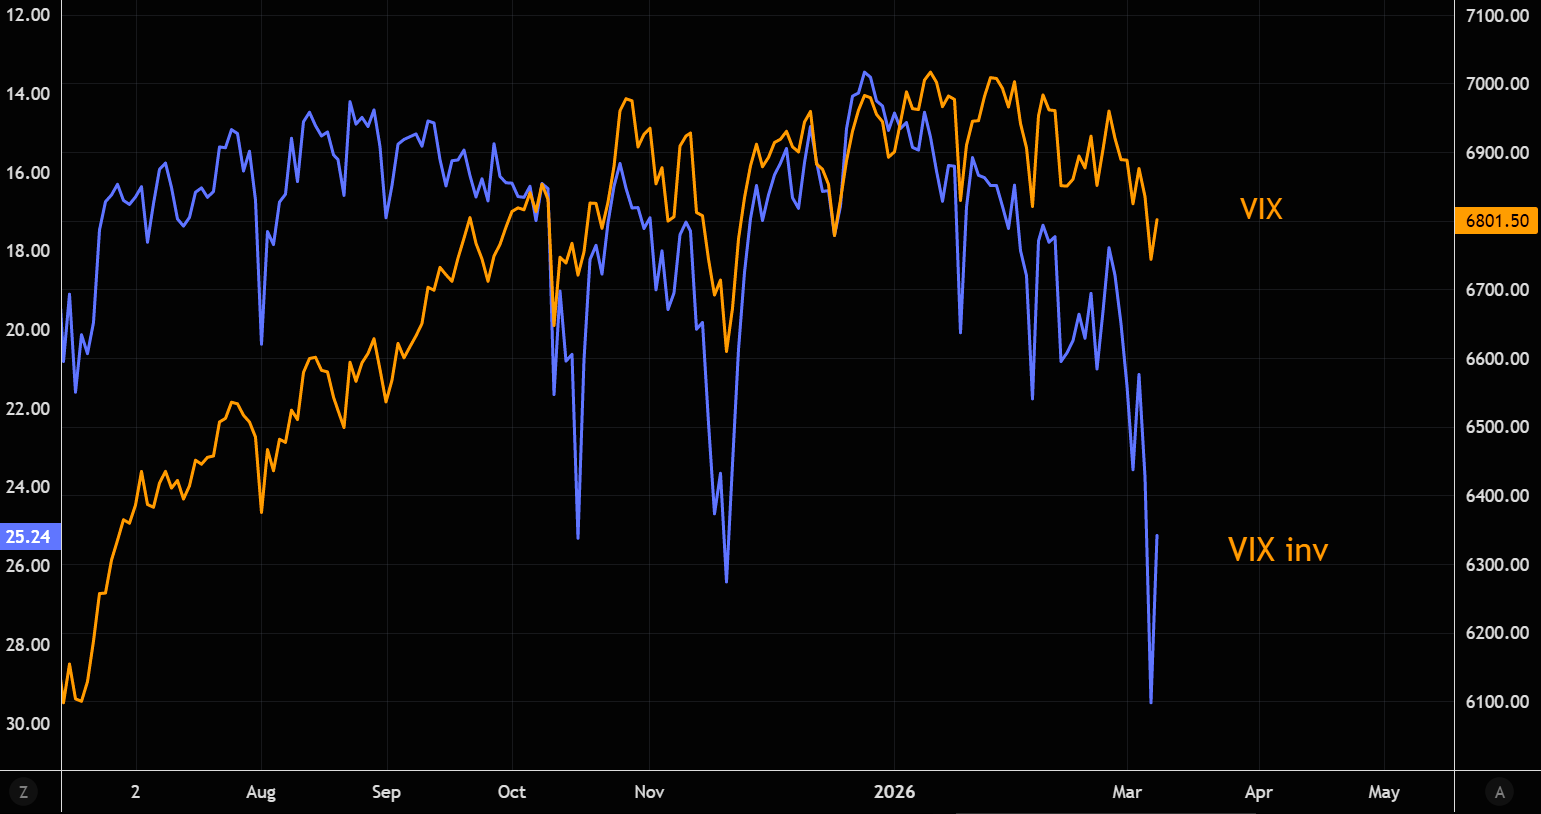
The vol overshoot
The crowd tends to forget that volatility is mean reverting. VIX printed a huge intraday reversal, although the gap versus SPX still remains relatively wide. Chart shows SPX vs VIX.
Source: LSEG Workspace
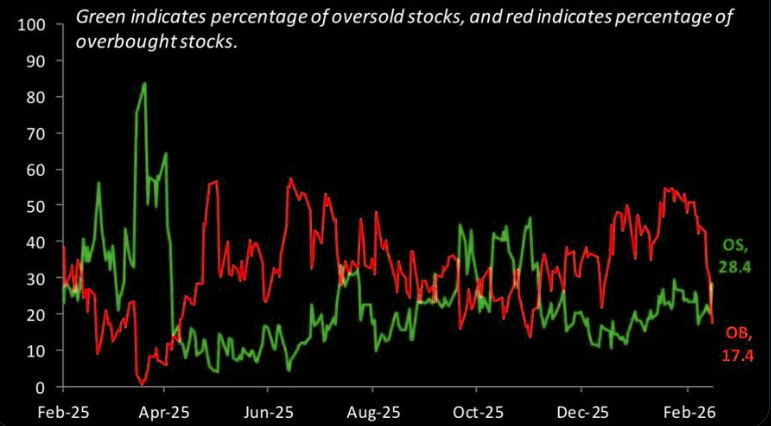
Oversold > overbought
Oversold stocks now outnumber overbought stocks after a long stretch of the opposite.
Source: Bespoke
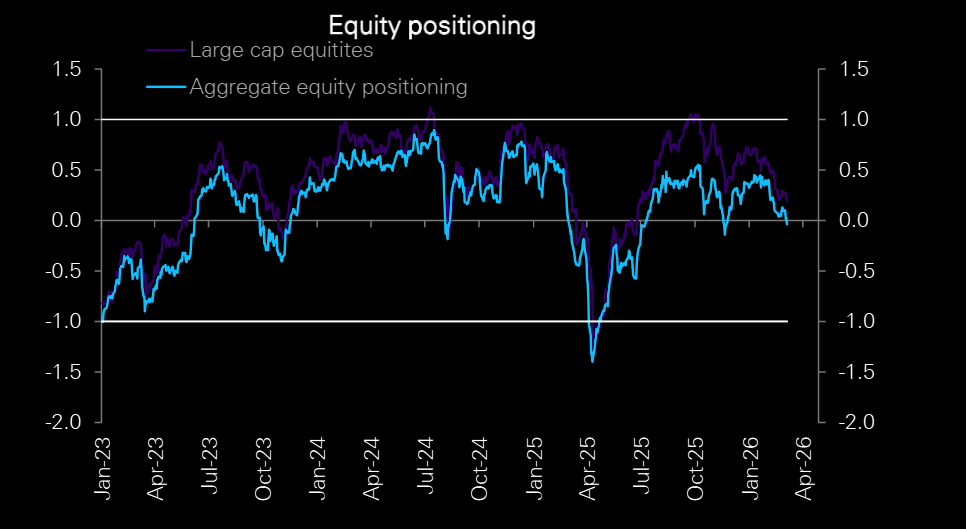
Slightly below neutral
DB: " Equity positioning has dipped slightly below neutral". More here.
Source: Deutsche Bank
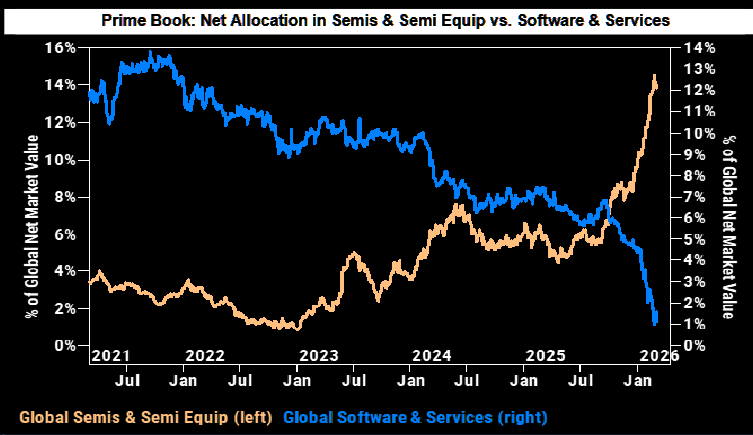
The buy
Software and Semis & Semi Equipment were by far the most net bought during the week. Net buying in Software was mainly driven by short covering in the US, while Semis and Semi Equipment saw inflows from both new long positions and short covers. Plenty of chasing potential in software if investors start going long the space. More on software here.
Source: GS
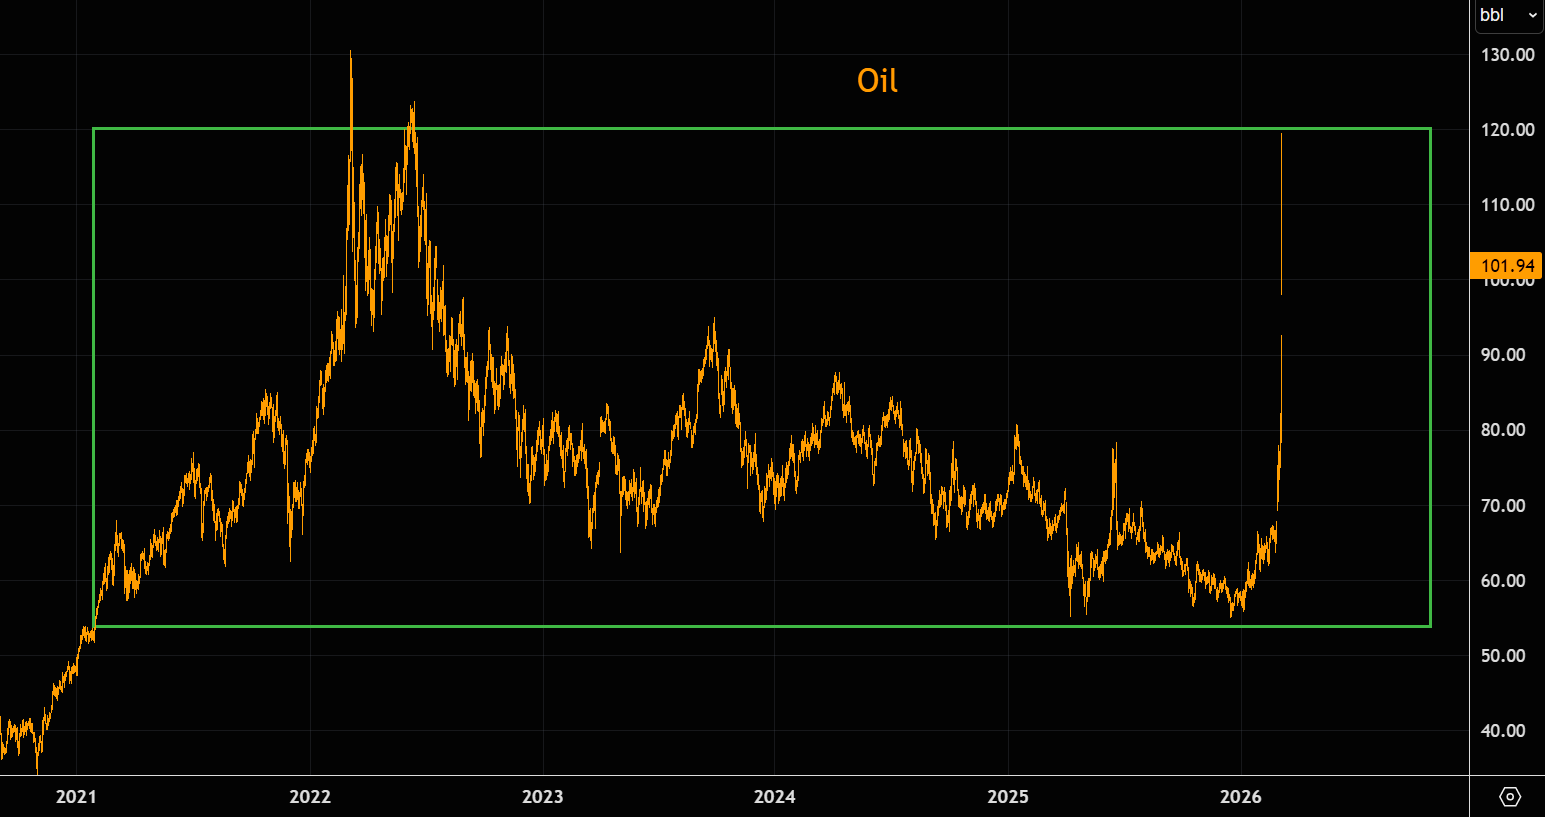
Mission accomplished?
In mid-February (here) we outlined our oil squeeze logic, writing: “It’s been trading above the 200-day MA for weeks, and a light golden cross (21 over the 200-day) has formed. A clean break above the trend line could unleash a sharp squeeze.”
We did not expect oil to explode in this fashion, but remember that oil typically mean-reverts over time, and chasing extremes is usually a very costly strategy. Notably, we essentially kissed the 2022 highs during today’s panic spike.
Source: LSEG Workspace
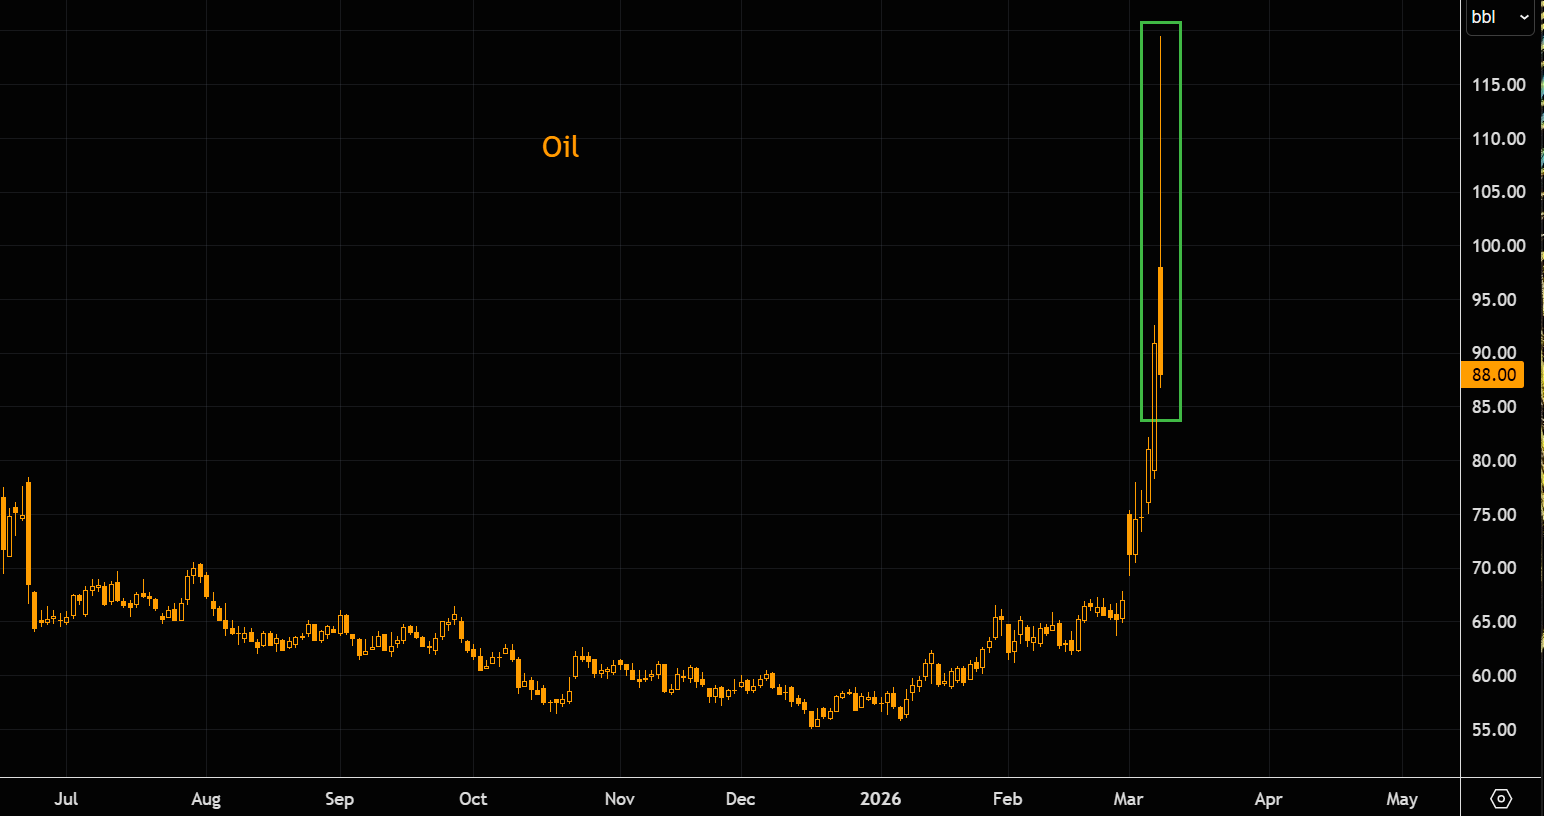
King shooting star
Earlier today (here), when oil was in full upside panic mode, we outlined our oil reversal logic and noted that a shooting star candle might be forming. Fast forward a few hours and oil has printed one of the biggest shooting star candles we have ever seen. Moves are beyond extreme, so trade accordingly.
Source: LSEG Workspace
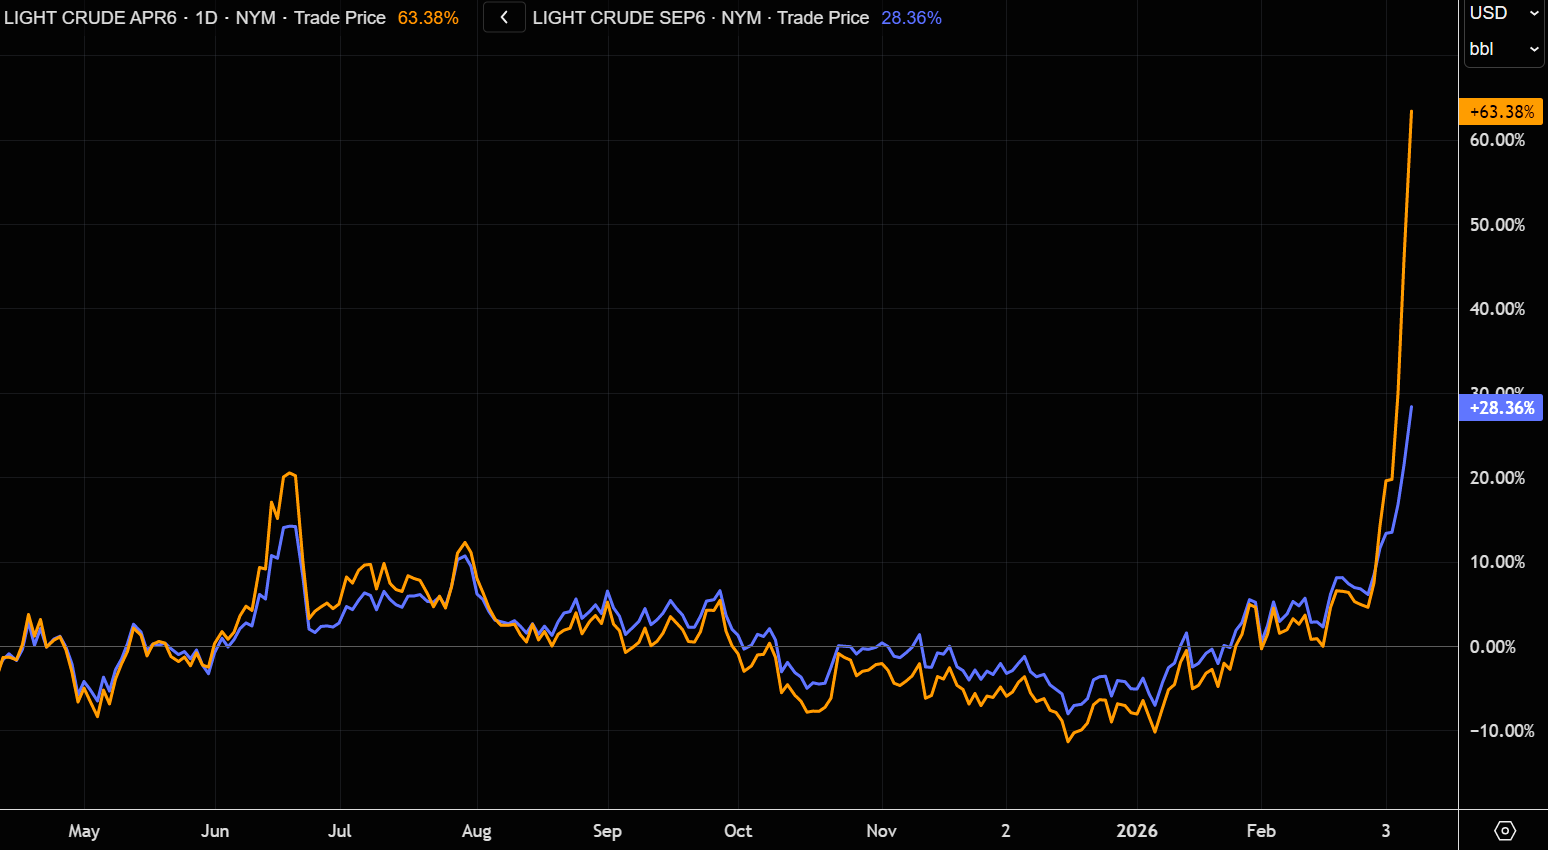
Will the oil shock spill over?
DB's macro guru Henry Allen:
1. Historically, major equity selloffs after oil shocks usually require at least one of three triggers: a large and sustained oil spike (+50–100%), a hawkish central bank response, or broader economic damage leading to recession.
2. Today we are closer but not there yet: oil has surged over +50%, but futures markets still expect prices to pull back, suggesting the shock may be temporary.
3. Policy and growth risks remain limited for now: markets price slightly more hawkish rates, but central banks haven’t shifted policy, and economic data is mixed rather than recessionary.
Chart shows crude 1 and 6 mths futures in % over the past year (before the massive reversal)
Source: LSEG Workspace
That gap vs SPX
SPX does not like surging bond volatility. The short-term gap between SPX and MOVE (inverted) has widened sharply. Watch this divergence closely.
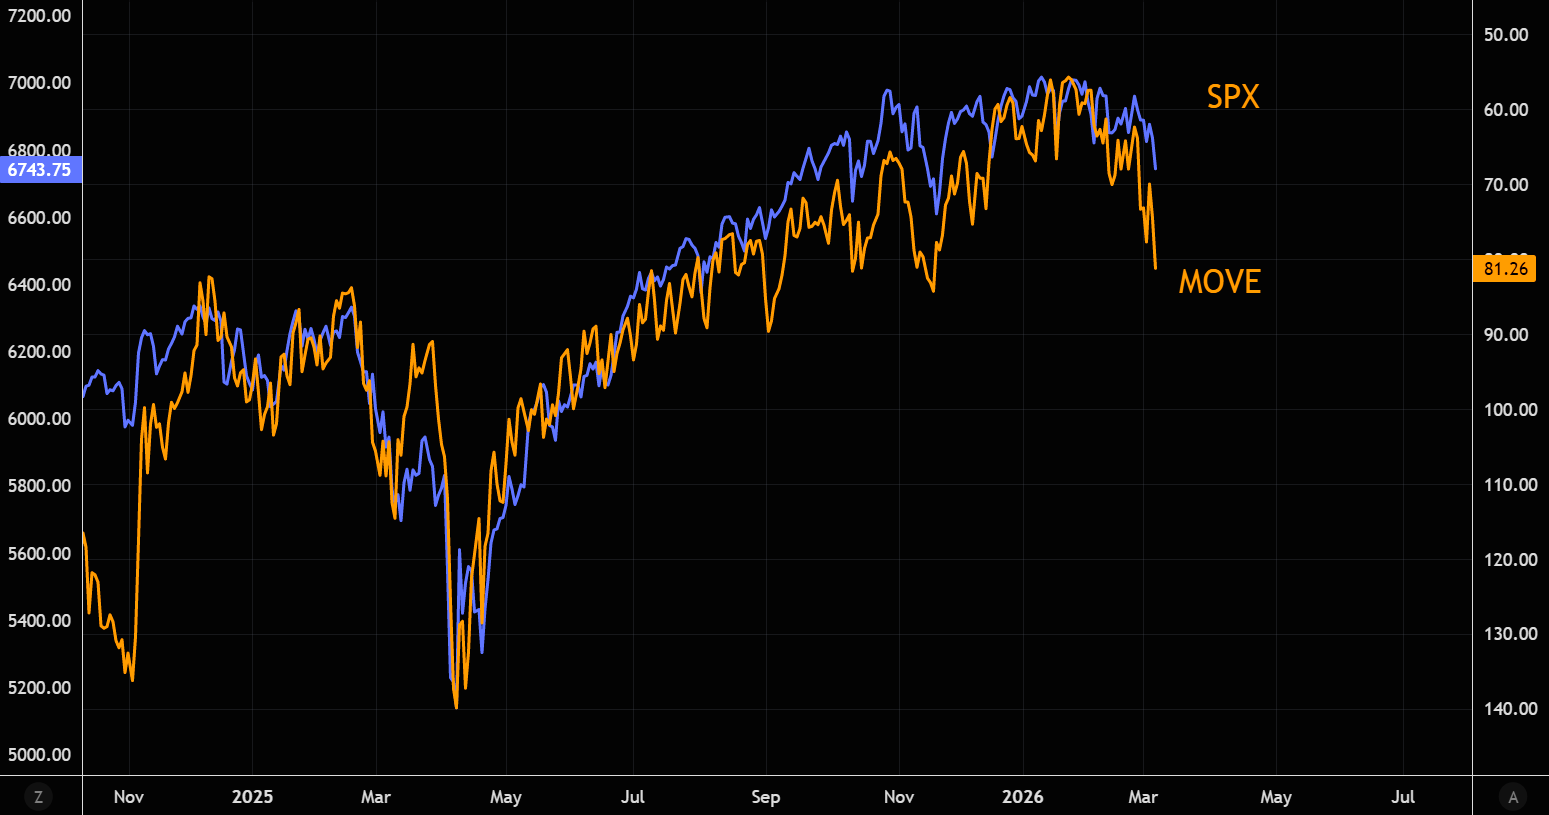
Source: LSEG Workspace