Everyone’s Long. Charts Are Rolling. Vol Is Waking Up.
The reversal
SPX has once again reversed in the upper part of the range. Price is now breaking below the short-term trendline, with the 50-day MA sitting just beneath. A decisive close below that level risks accelerating downside momentum. For us, the déjà vu from early 2025 remains very much intact.
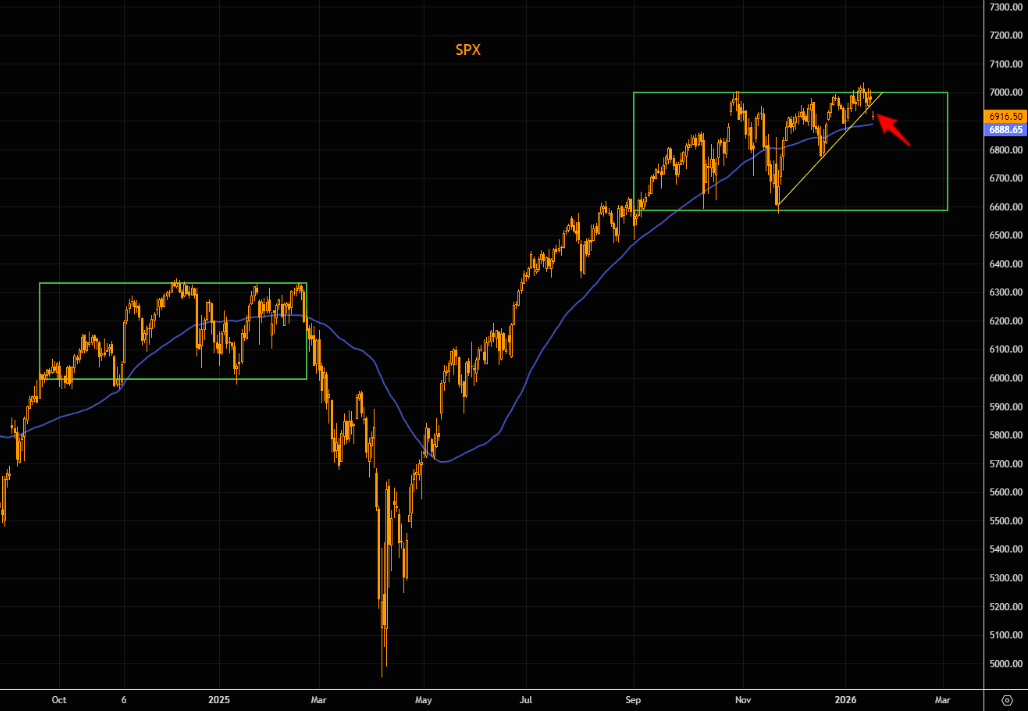
Source: LSEG Workspace
Breaking
NDX is breaking below the wedge like formation we have been pointing out for some time. Let's see how this plays out, but we are trading below the 50 day MA, hitting the 100 day as of writing.
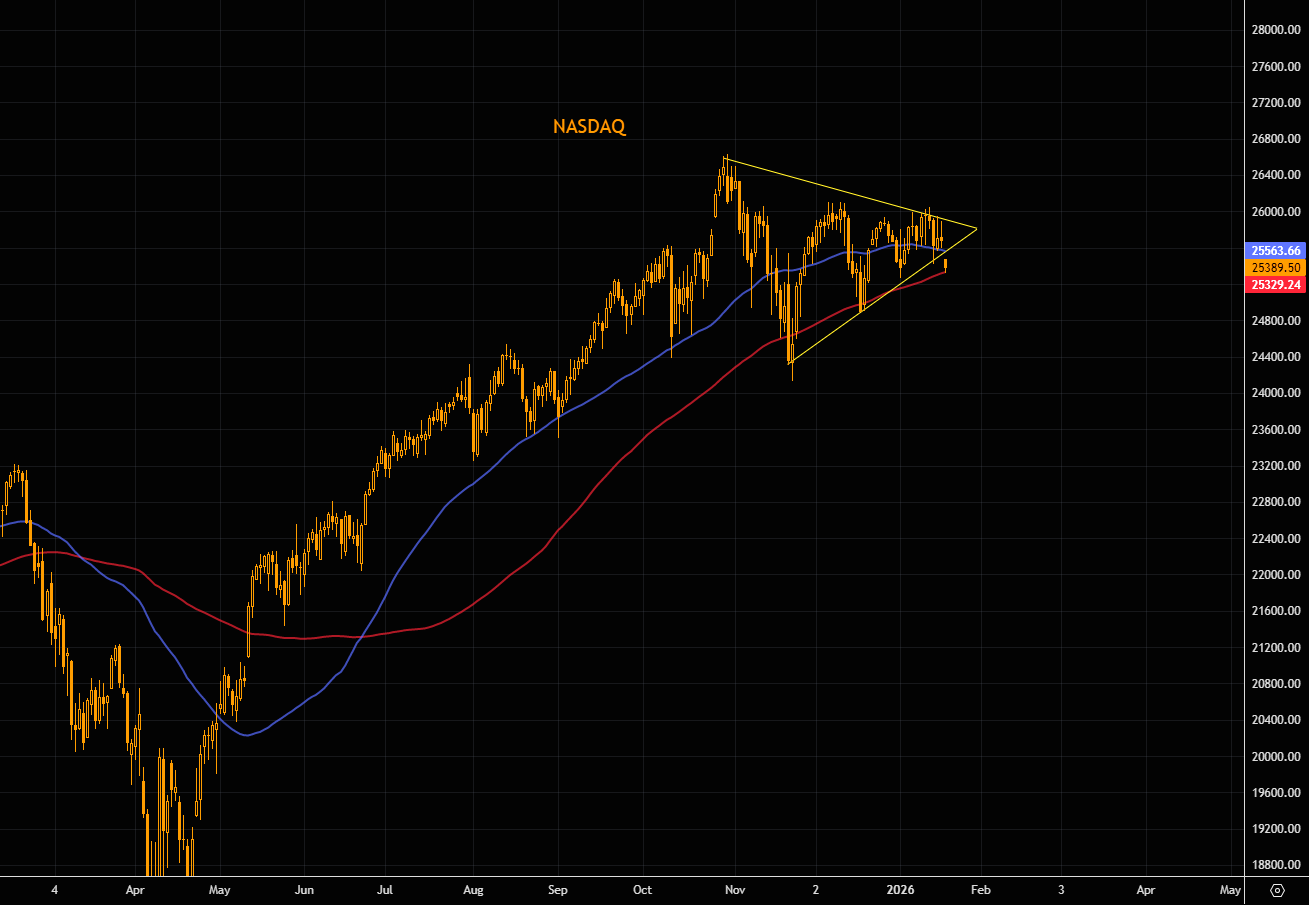
Source: LSEG Workspace
Bulls are many
It would be perfect if SPX pulled back a few percent, just as AAII bulls hit their highest levels since autumn 2024.
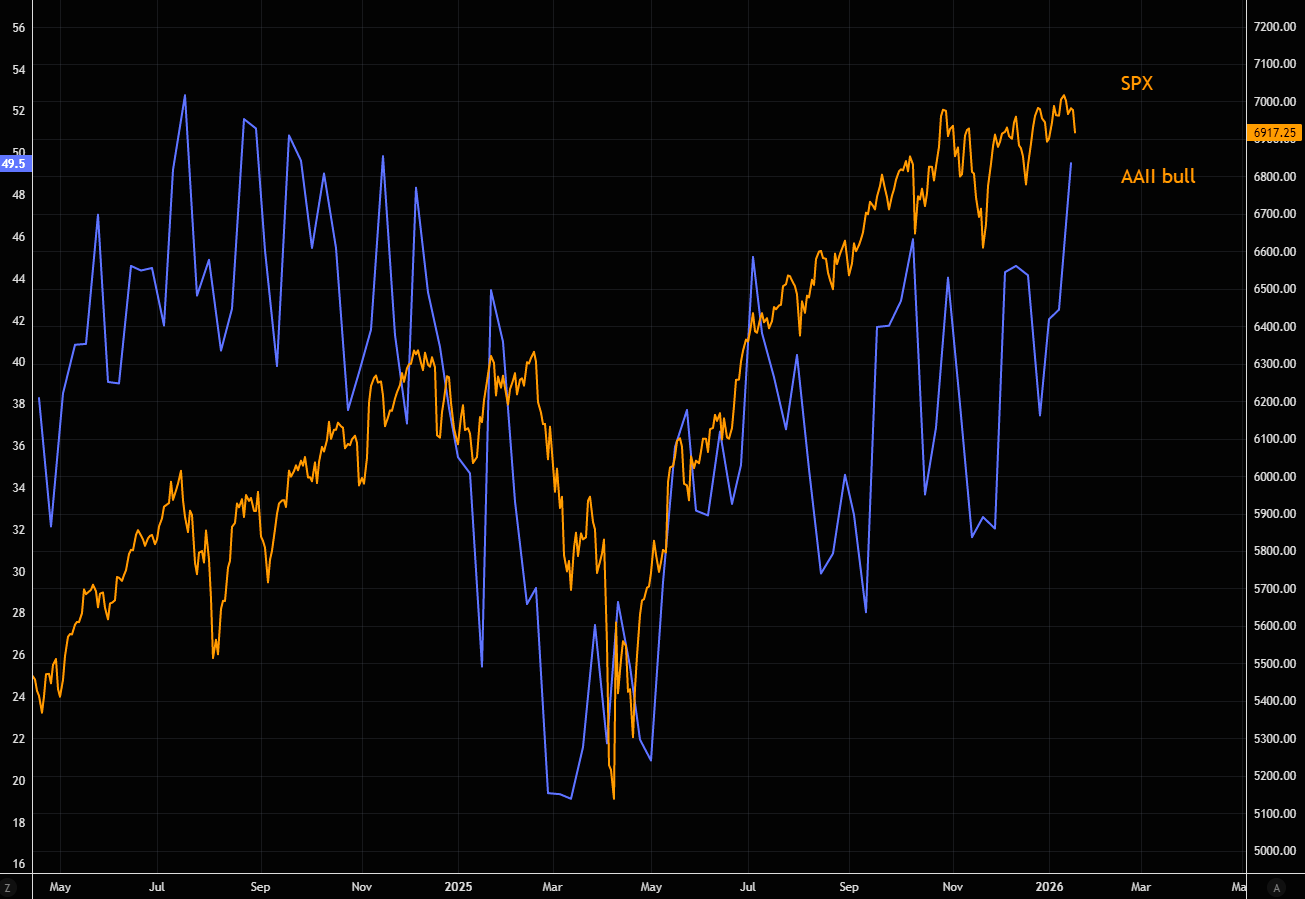
Source: LSEG Workspace
Greed
We aren't in extreme greed territory, but closed last week with greed at the highest levels since September.
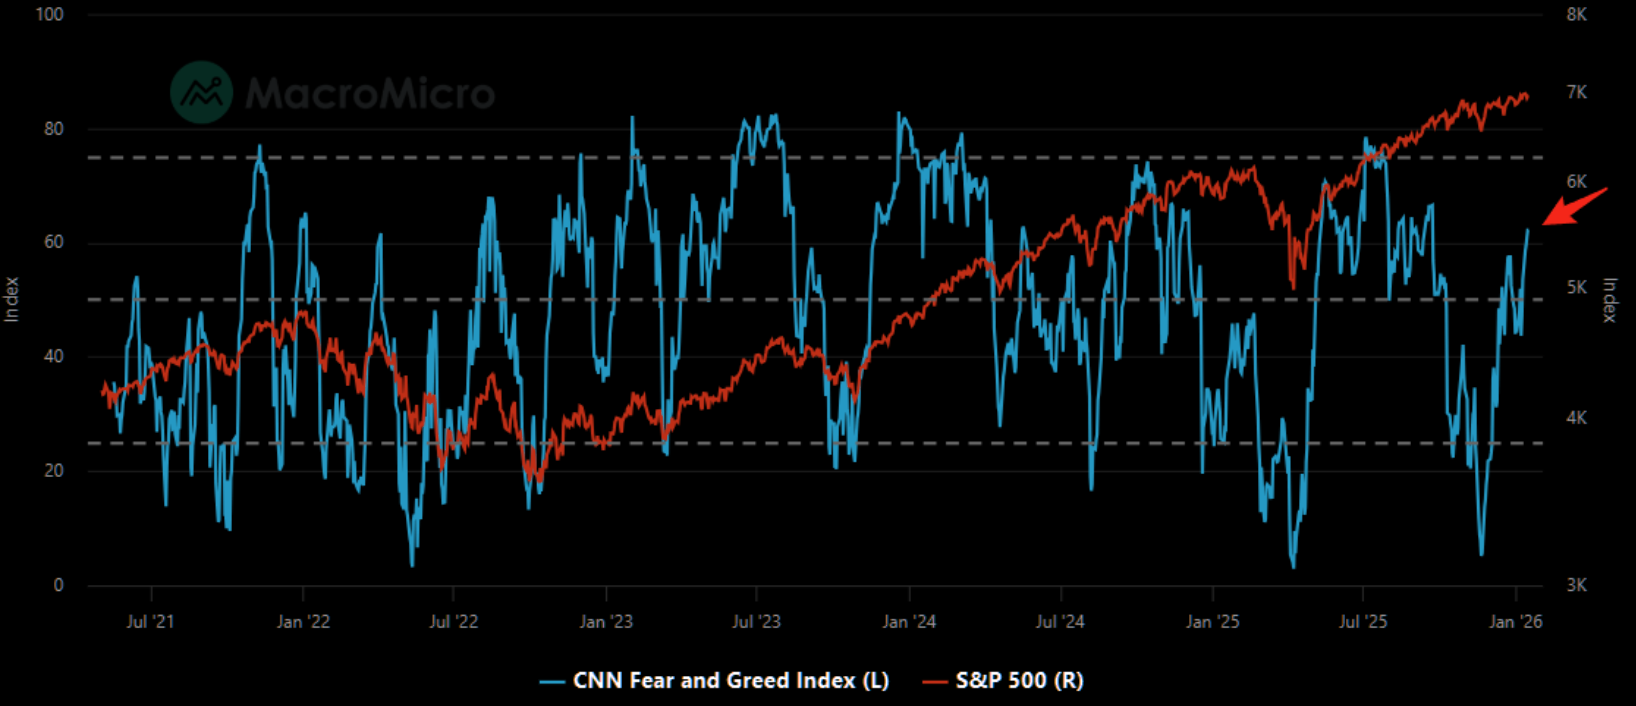
Source: MacroMicro
Aggressive reaction
The bid in VIX is rather aggressive. Yes, SPX futures are down today, but the bid in VIX is reacting much more than the underlying move. Our latest notes on hedges/volatility here and here.
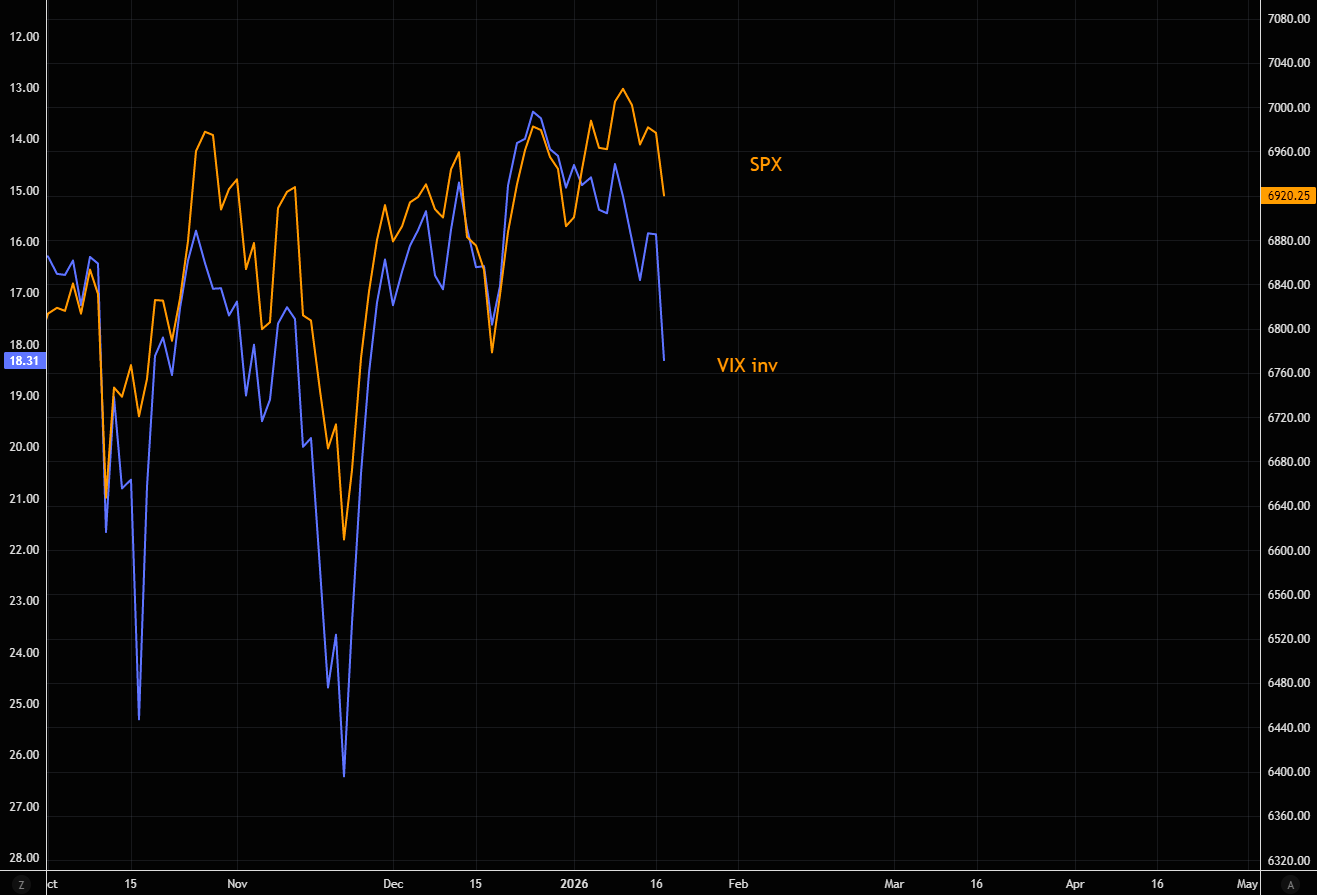
Source: LSEG Workspace
Some have been nervous
We have been pointing out the relatively aggressive bid in downside protection over the past week. Note SDEX closed out the week at the highest levels in a while. That is before the move lower in futures today, so plotting SPX index vs SDEX.
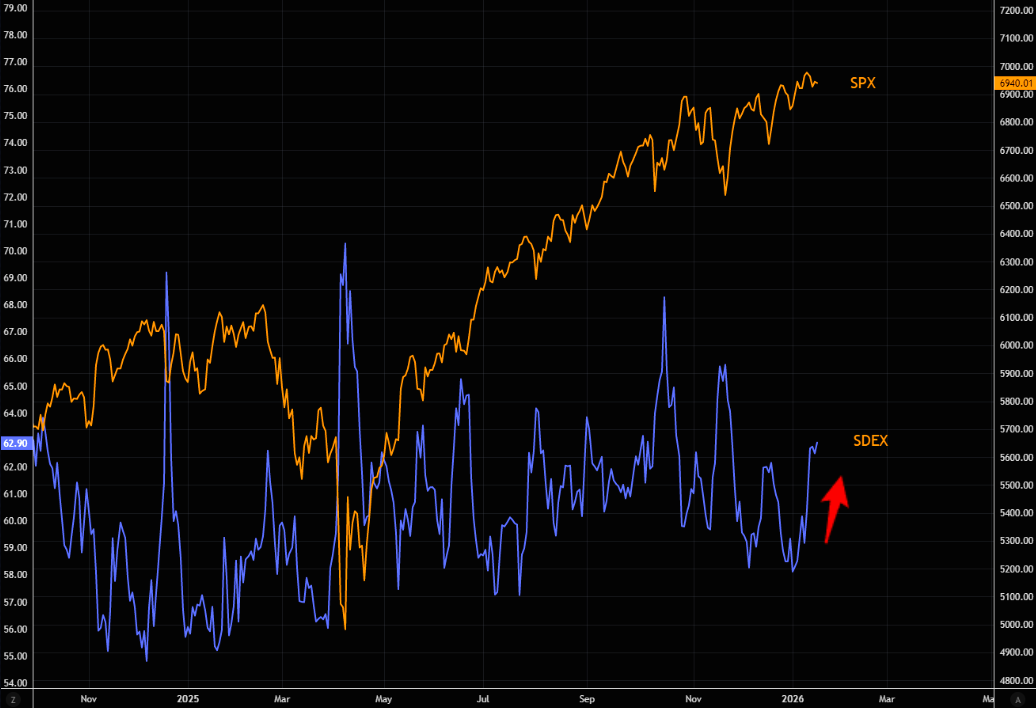
Source: LSEG Workspace
The long
The institutional US index futures long is very long...
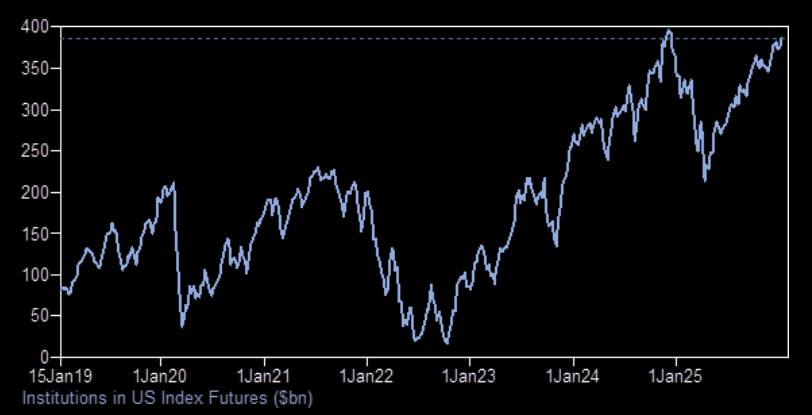
Source: GS
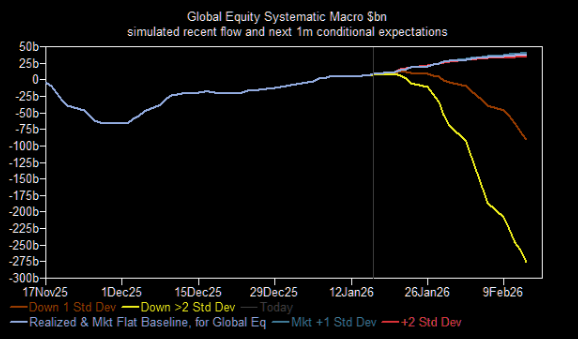
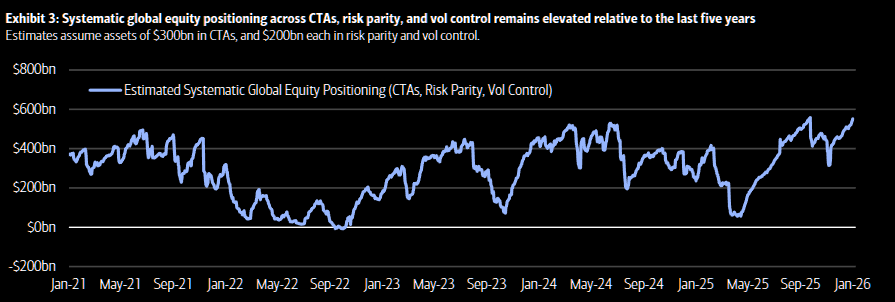
Momentum players
BofA on the CTA crowd coming into this week: CTAs with medium- to long-term trend signals remain heavily stretched long across U.S., European, and Japanese equities. With realized equity volatility at depressed levels, vol-sensitive strategies have likely pushed aggregate systematic exposure to its highest level in roughly five years. The risk profile is asymmetric: downside moves could trigger material CTA unwinds, while flat to higher markets would likely see only gradual adjustments. Their models suggest CTA selling would begin after declines of roughly 3% in the S&P 500 and Nasdaq, 5% in the Russell 2000, 3.5% in the EURO STOXX 50, and 6% in the Nikkei.
Source: BofA
Convexity
Downside convexity is juicy to the downside.