Everything Is Bullish Except the Price
No bueno
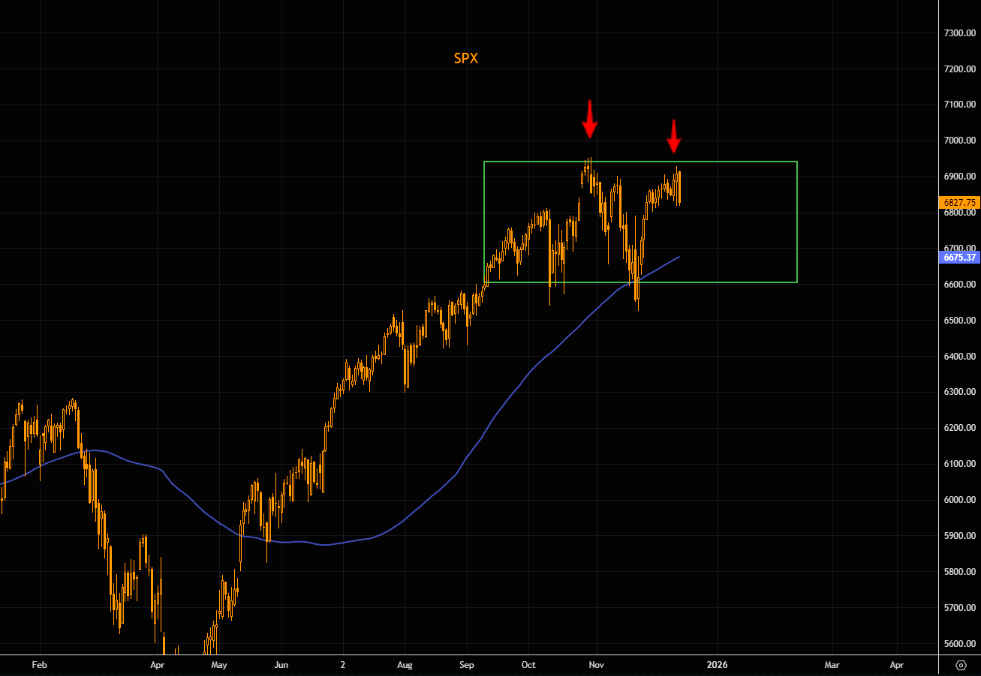
Earlier today we pointed out: "SPX has produced rather big volatility over the past 2-3 months, but gains haven't been overly impressive. Yes, we are at ATHs basically, but only up 100 points from early October. The volatile, non trend price action, reminds us a bit of late last year/early 2025. That ended with a double top and a puke. Are we looking at another double top here?"
Market reversed aggressively today. Let's see how this plays out, but SPX remains trapped inside the range that has been in place for months....and we are now only 20 points higher compared to early October.
Source: LSEG Workspace
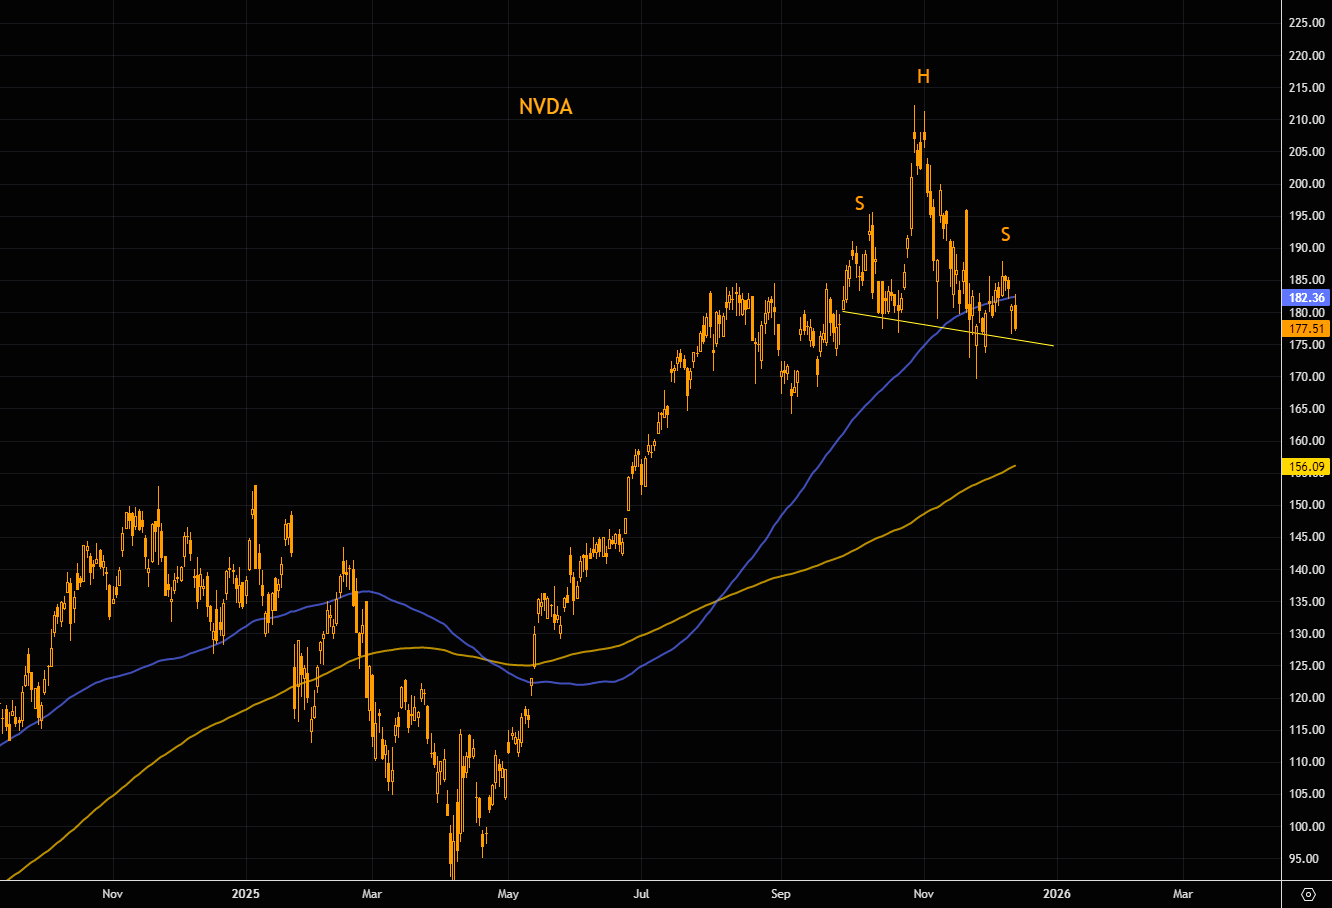
The world's "biggest" HS?
The world's hottest stock has done nothing since August basically. One thing to watch out for is the possible head and shoulders formation. Note we are trading below the 100 day...200 day at $156.
Source: LSEG Workspace
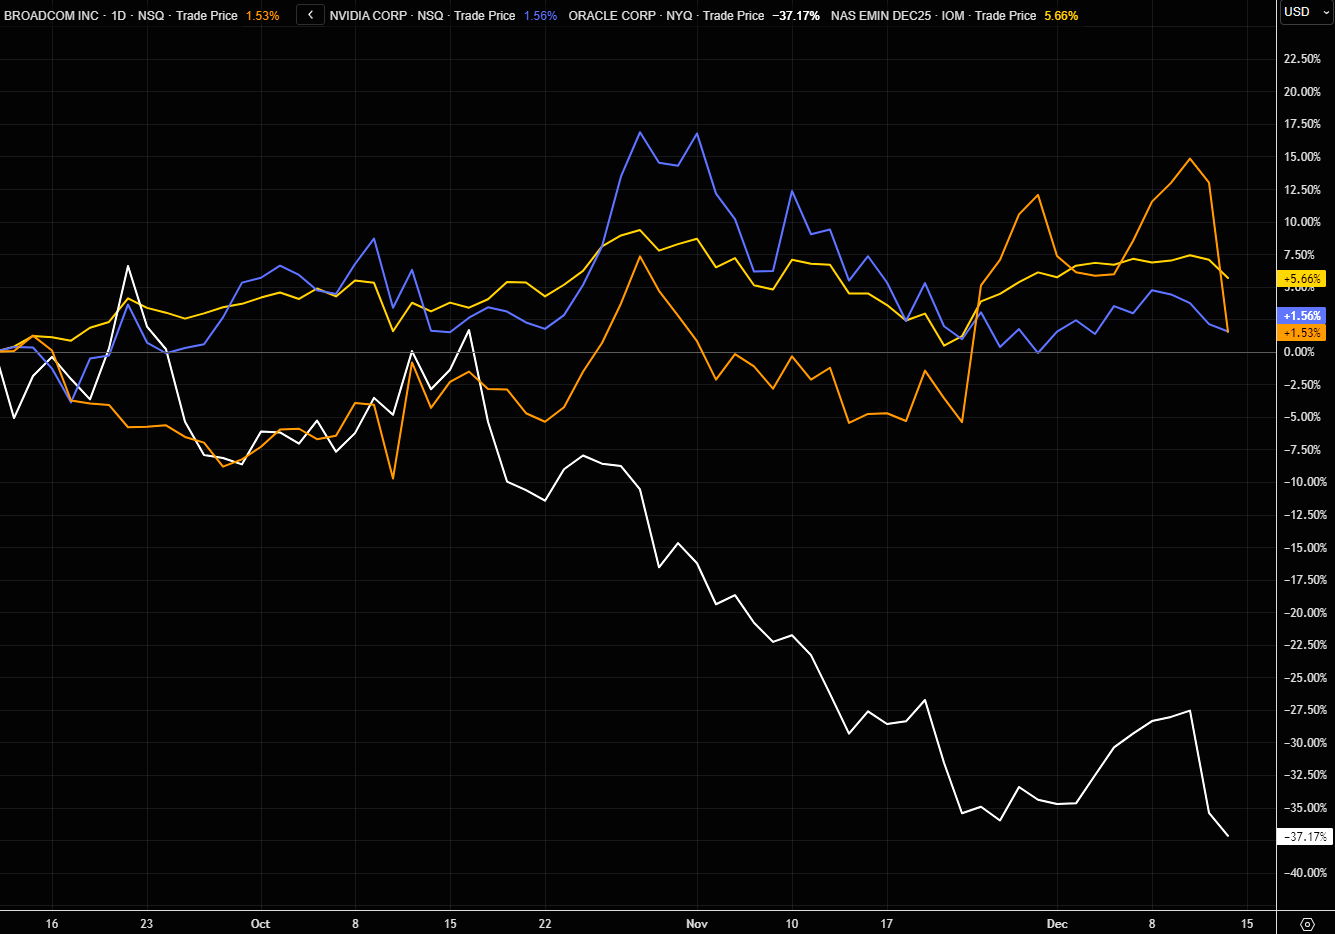
Tech is all the rage...
...but it is hard to see a proper tech bull with ORCL, NVDA, and now AVGO all lower than the NASDAQ over the past 3 months.
Source: LSEG Workspace
Tech blues
Biggest 2 week outflow in tech since February 2025.
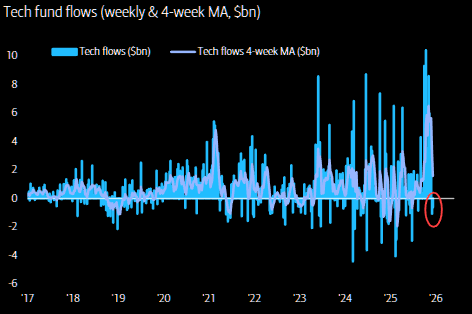
Source: BofA
The BTC connection
BTC continues to trade offered. Looks like NDX is starting to notice. Maybe BTC actually matters for the overall risk sentiment...
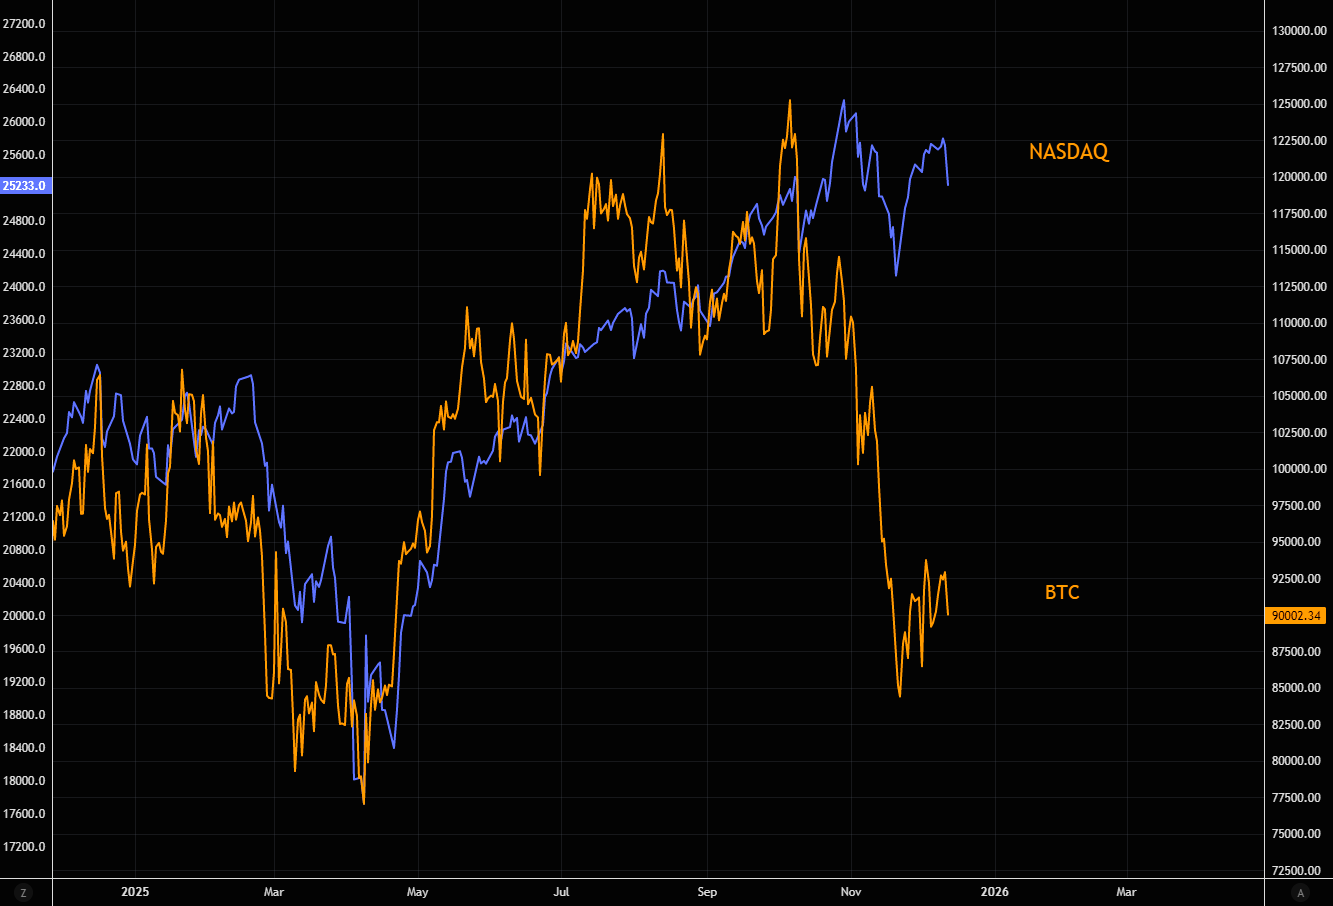
Source: LSEG Workspace
SPX vs rates
Gaps are getting very wide...SPX vs the 10 year (inverted) and the 30 year (inverted).
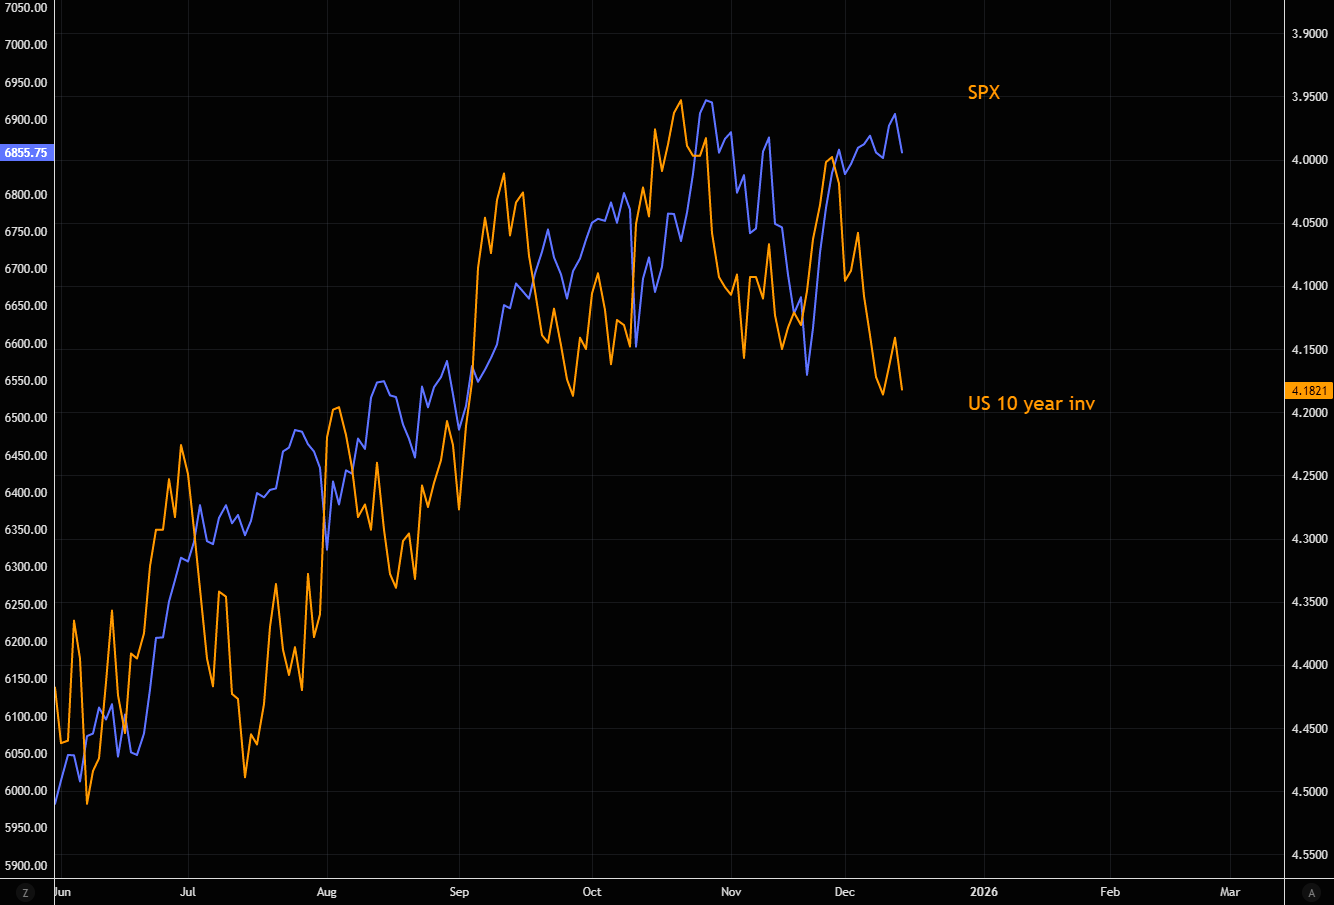
Source: LSEG Workspace
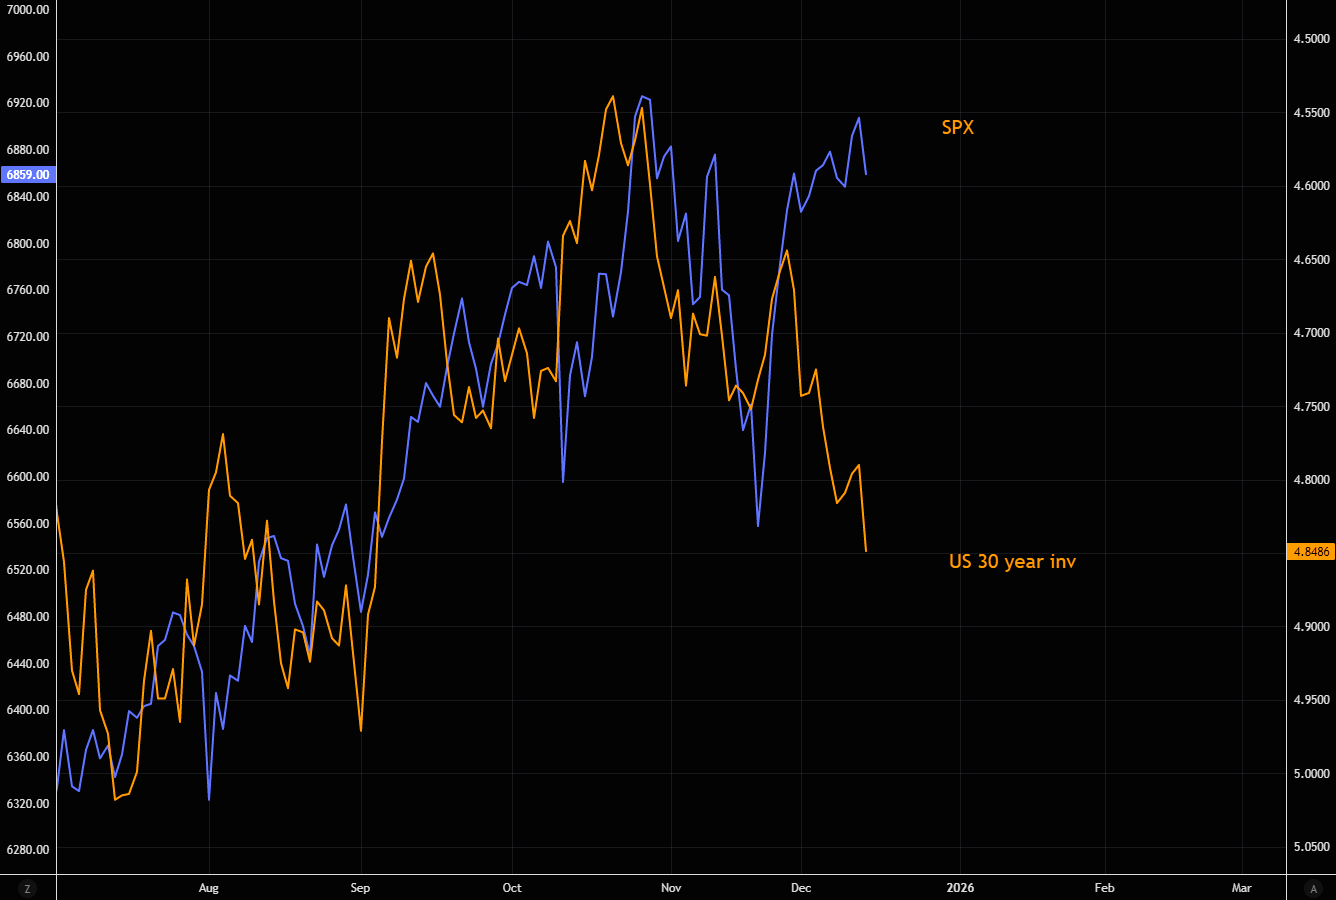
Source: LSEG Workspace
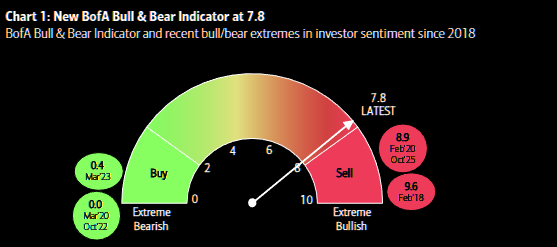
New Bull/Bear indicator in sell zone
BofA's has modified its Bull/Bear indicator. The latest reading of their revamped Bull & Bear indicator stands at 7.8, putting sentiment back near extreme bullish territory. The indicator last peaked at 8.9 on Oct 1, 2025, levels previously seen only in Feb ’18 and Feb ’20, while the most recent extreme bearish readings occurred in Mar ’20, Oct ’22, and Mar ’23.
Source: BofA
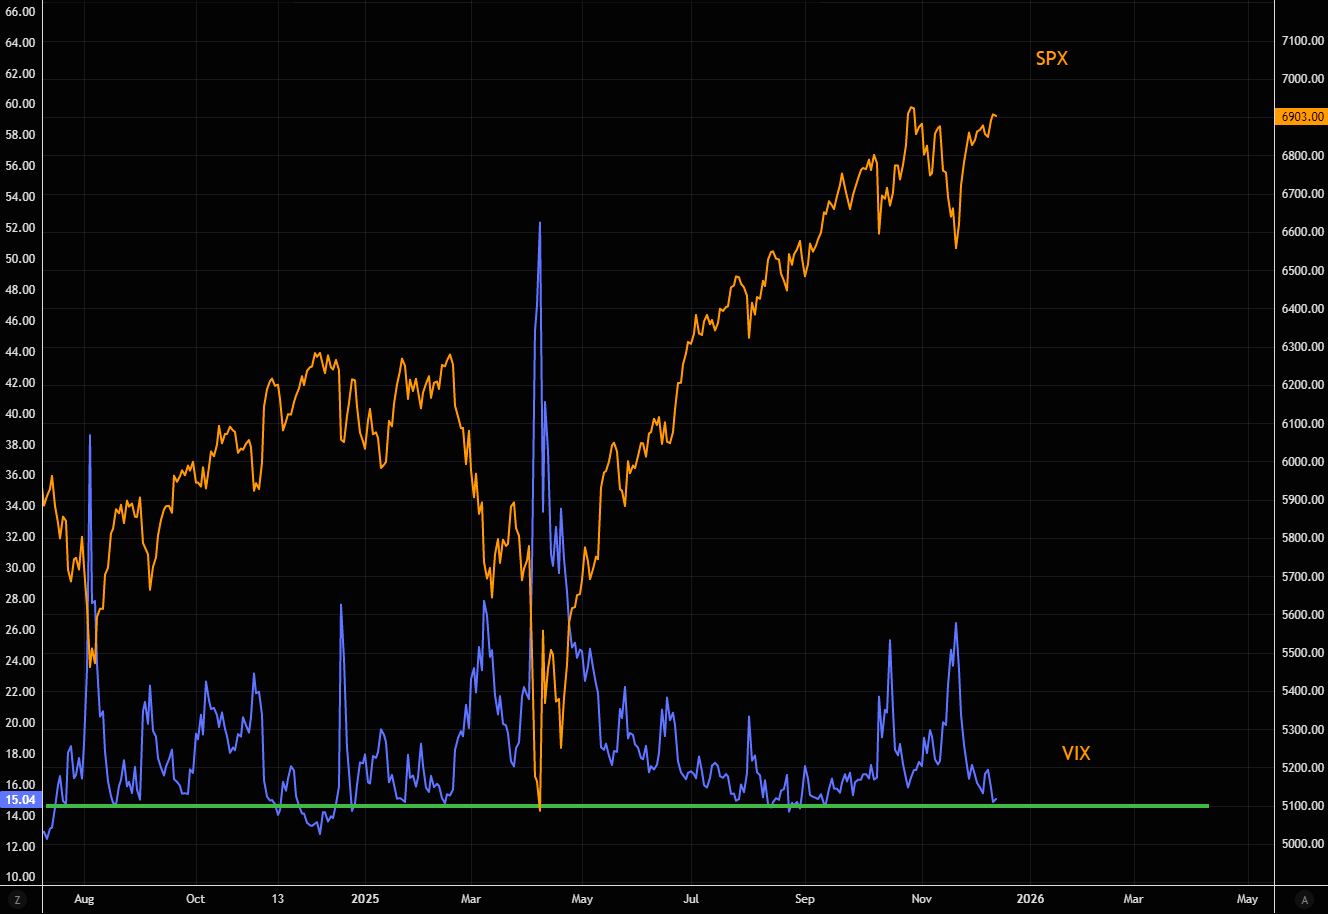
Natural floor
VIX has reset sharply lower and is now trading around its “natural” floor. This is not a technical support level to buy, volatility isn’t traded via chart patterns, but it is where using volatility starts to make sense. VIX is not dirt cheap given subdued realized volatility over the past two weeks, yet expressing views through options rather than the underlying looks sensible. Options work well for replacement strategies or broad portfolio hedges. Expecting materially lower VIX from here feels naive.
Source: LSEG Workspace
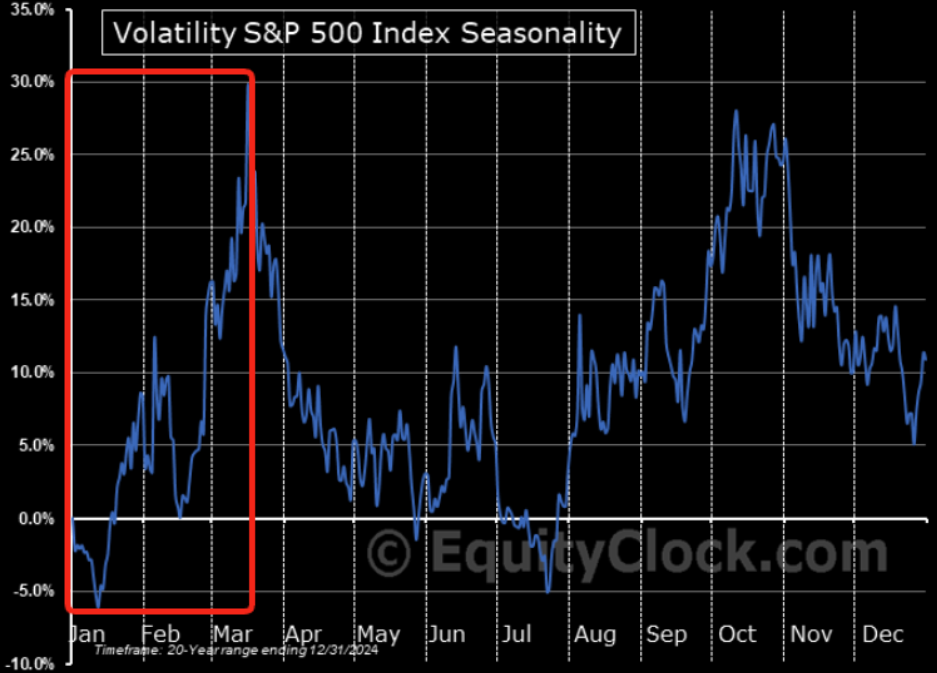
VIX prime time
VIX seasonality is strong and starting soon...