Extreme Fear Returns — Stocks Still Clinging To The Range
Still stuck
SPX remains trapped inside the “eternal” range. Overnight lows printed right at the range floor. So far today we are seeing a rather big hammer candle develop. The situation is fluid, so let’s see how this closes, but the resilience of SPX is almost ridiculous. Note we are trading right on the 200-day MA.
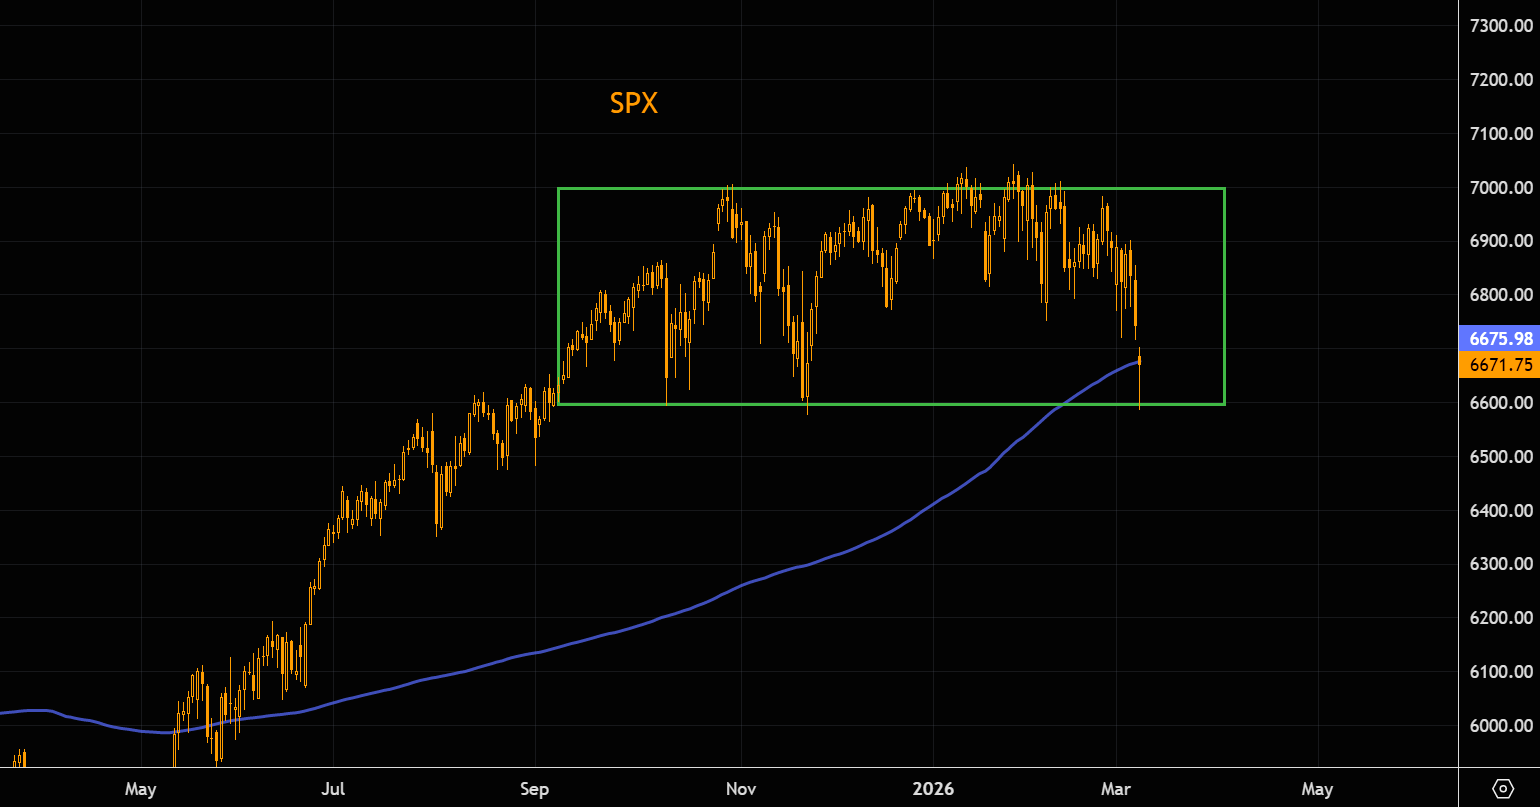
Source: LSEG Workspace
NASDAQ too
NASDAQ remains trapped inside the range that has been in place since last autumn. A hammer candle is forming at the range lows, but a bigger breakdown could also be in the making. Note we could close below the 200-day MA today, something not seen since the bull market started last year.
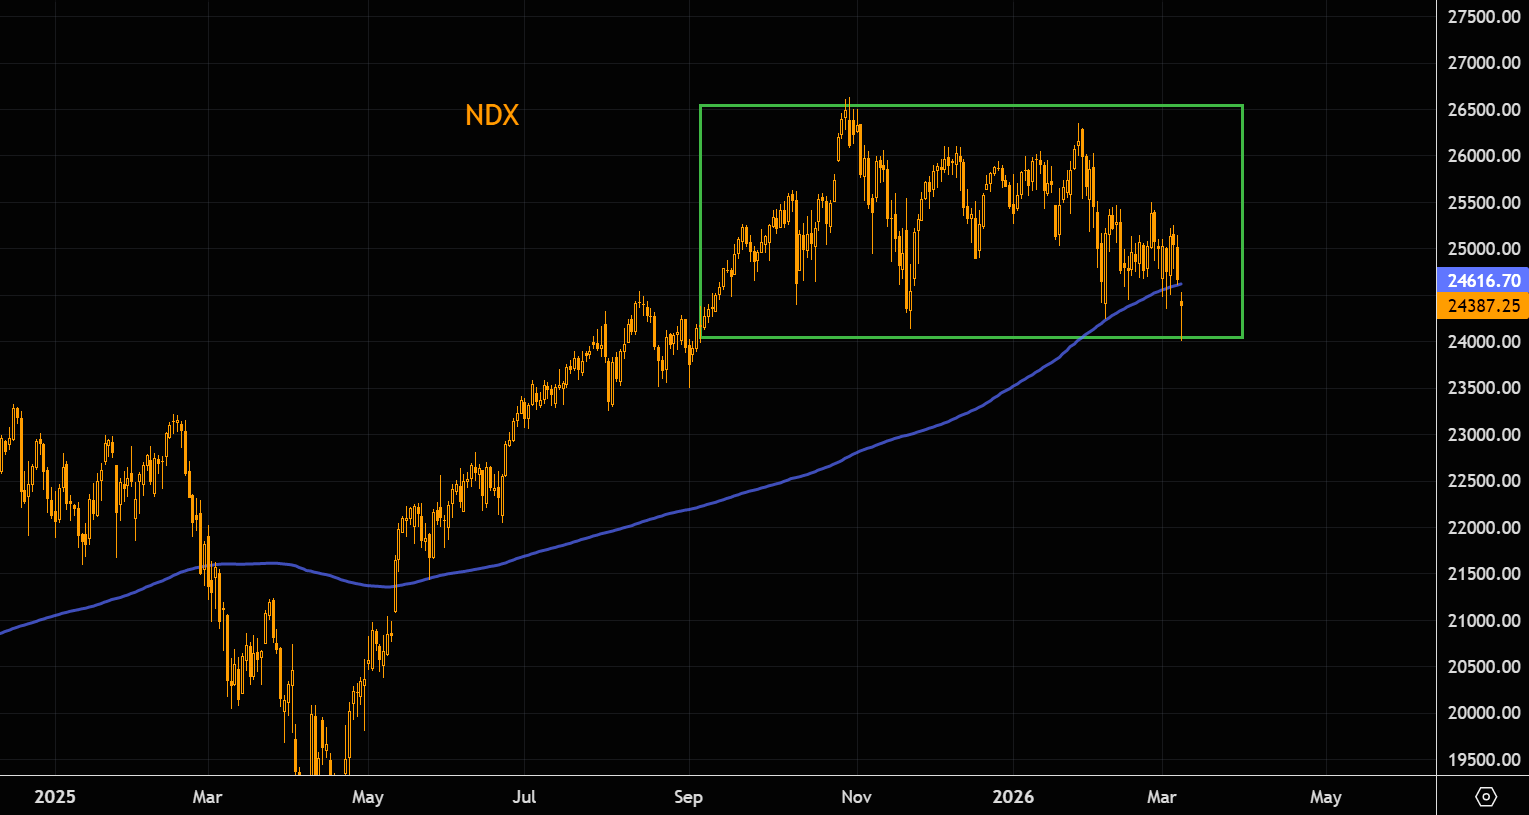
Source: LSEG Workspace
That déjà vu
Our déjà vu logic we outlined weeks ago continues to play out almost perfectly, including NASDAQ breaking below the 200-day, basically on the day compared with last year. Afraid of missing a possible bounce, or a bigger breakdown? 24,000 (futures) is the line-in-the-sand level to watch.
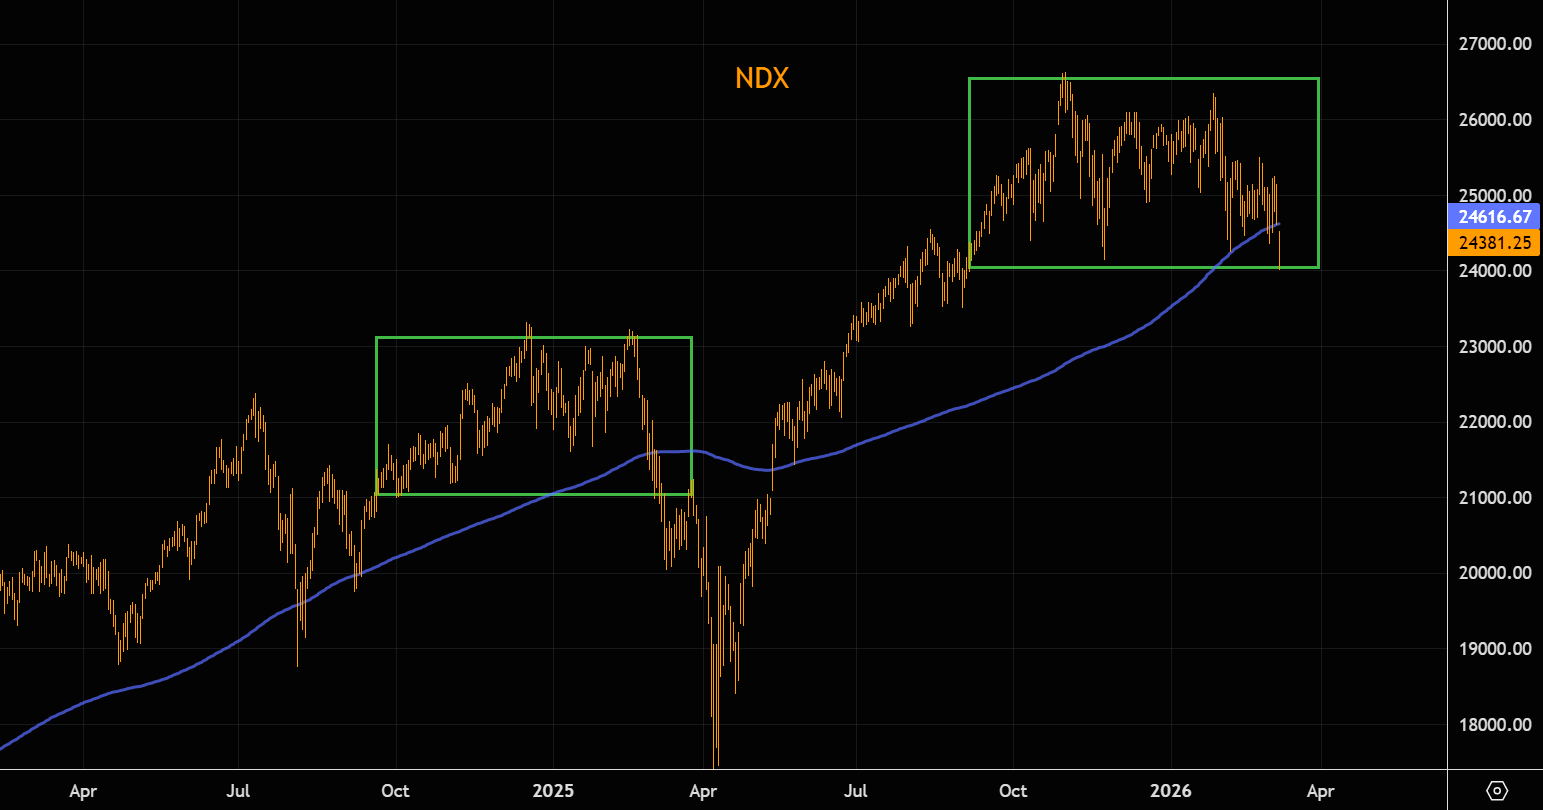
Source: LSEG Workspace
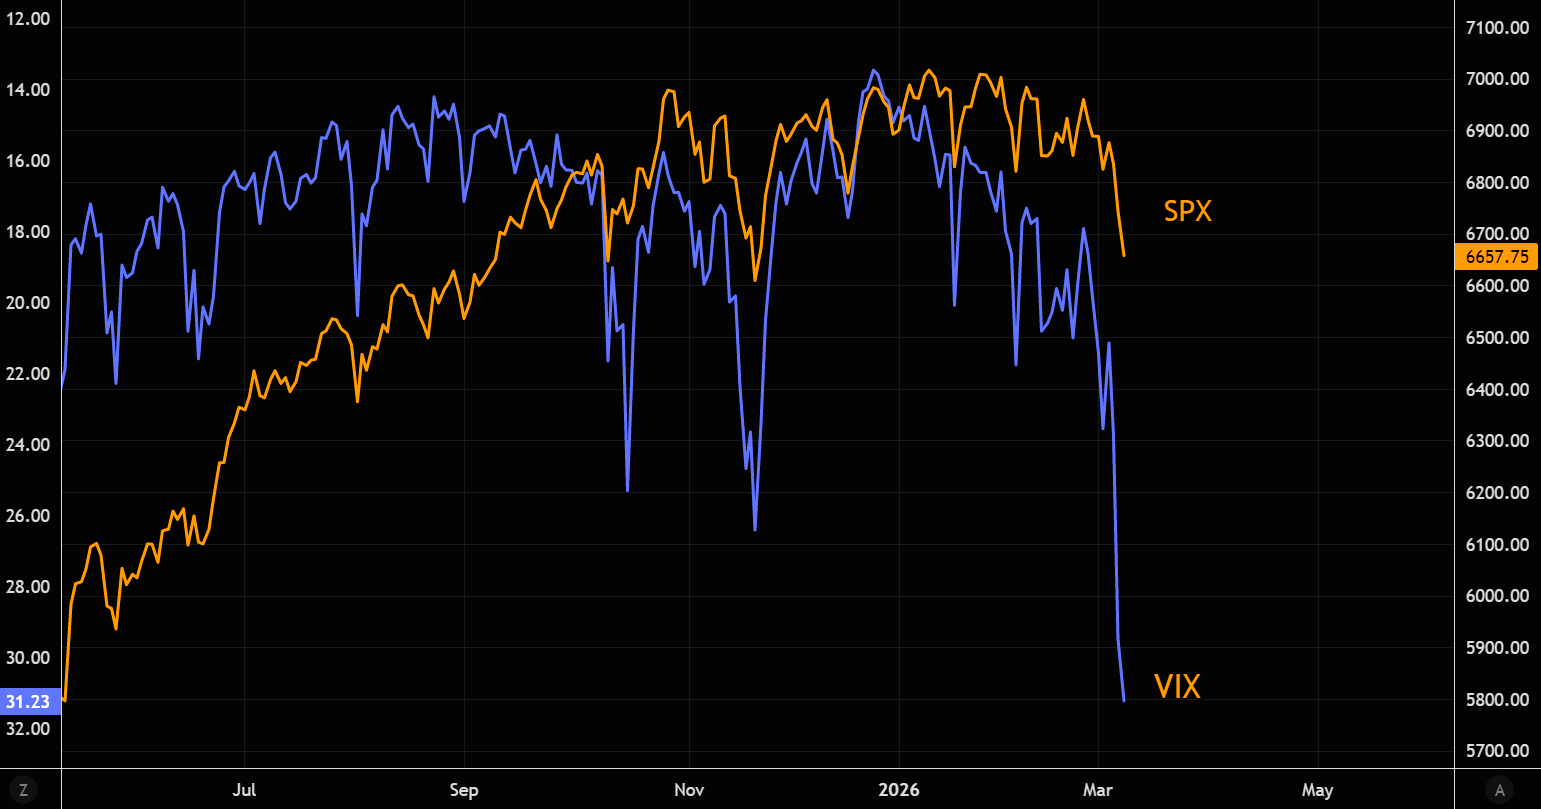
Things are stressed
VIX is not pricing a continuation of the SPX range. The short-term reaction in volatility has been very aggressive. Chart shows SPX vs. VIX (inverted).
Source: LSEG Workspace
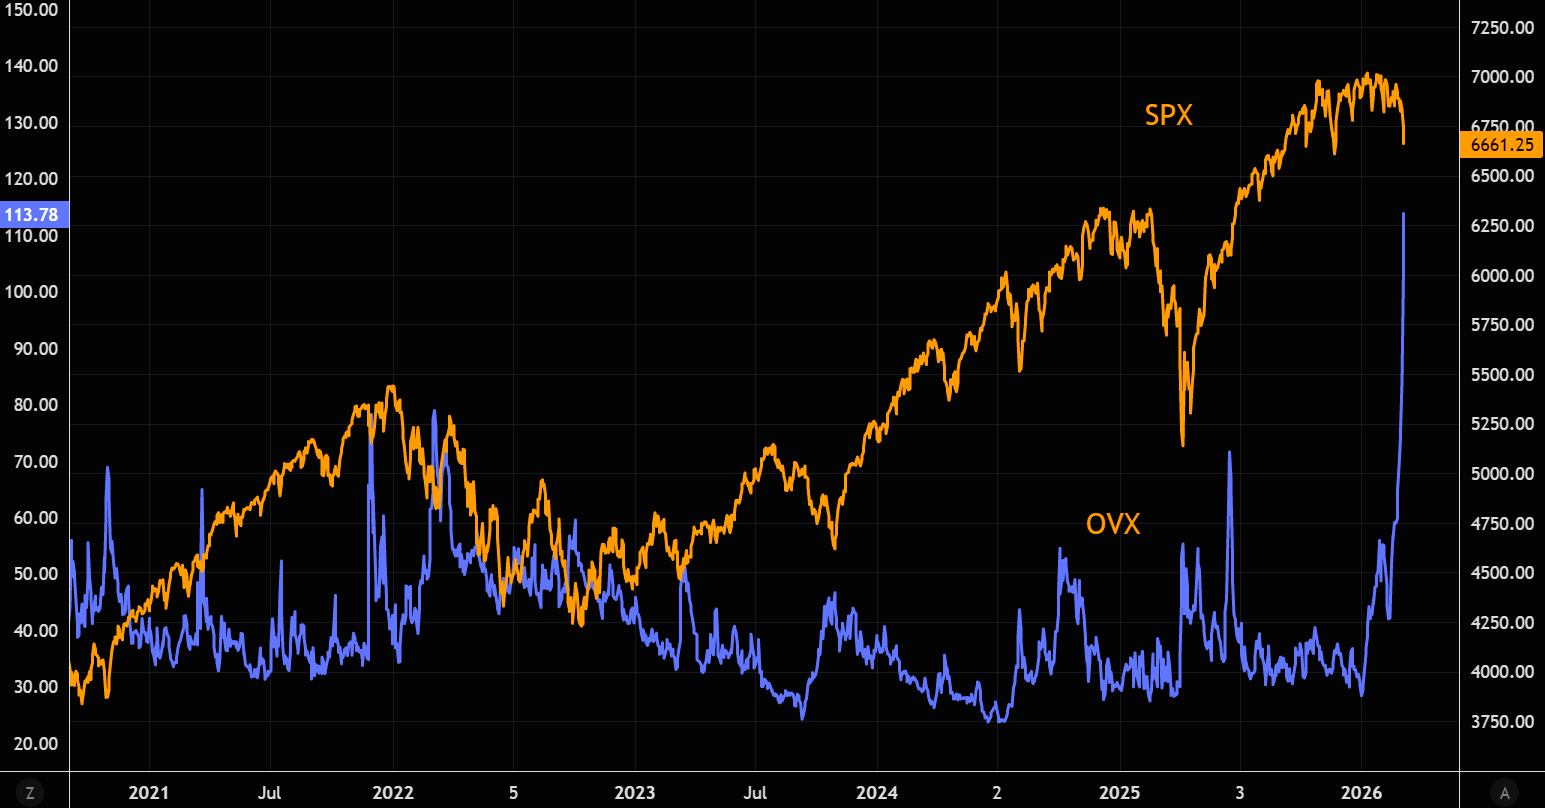
All about oil
There is no clear relationship between SPX and oil volatility, but with OVX printing 114 as of writing, things are beyond wild in the oil volatility space. Can SPX really stay inside the range with oil volatility pricing more than 7%+ daily moves going forward?
Source: LSEG Workspace
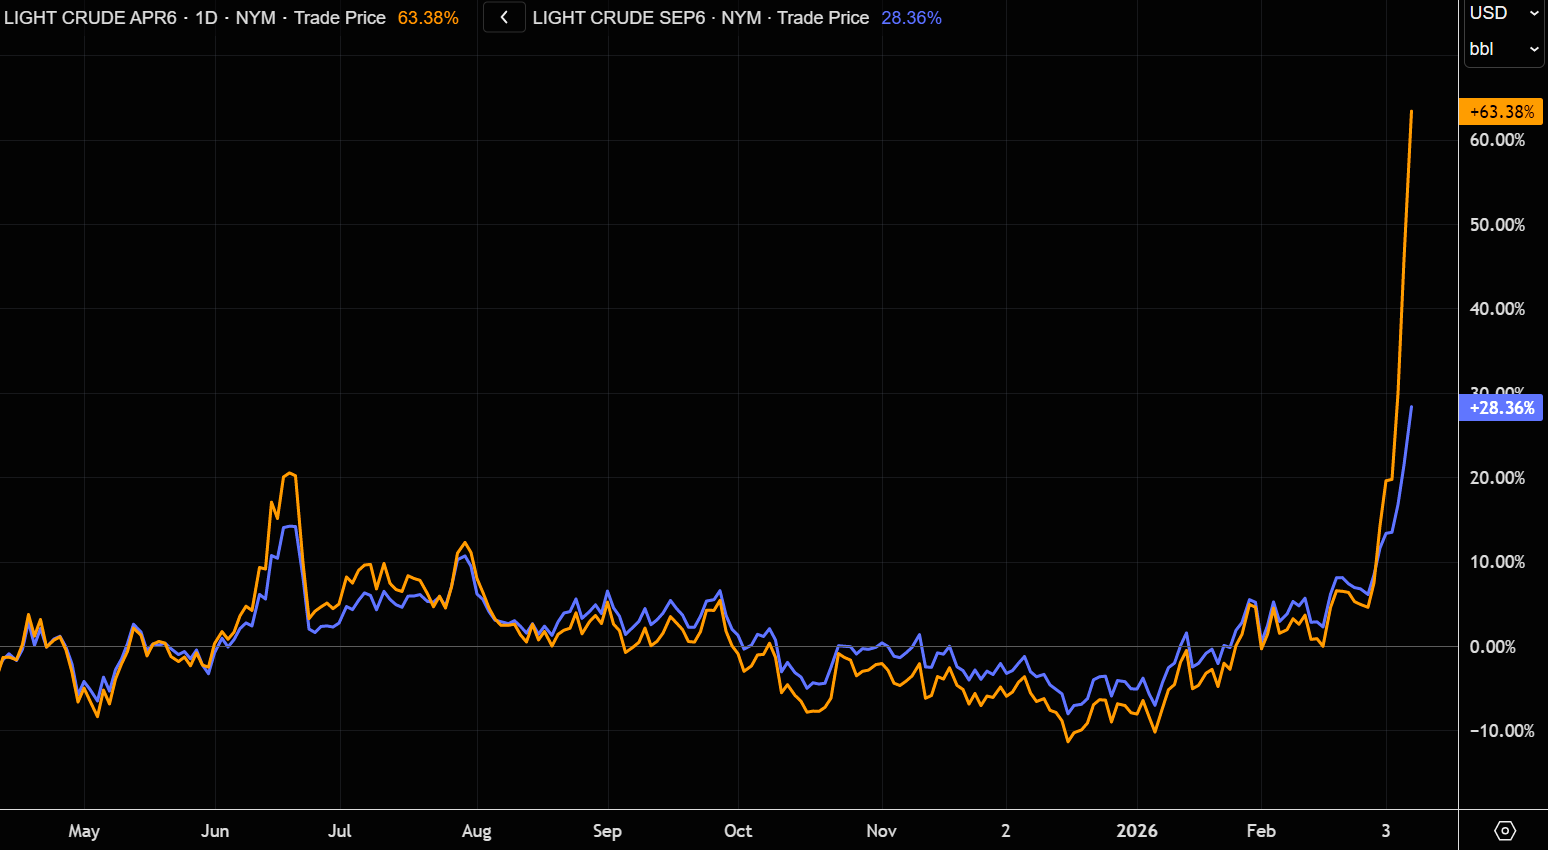
Will the oil shock spill over?
DB's macro guru Henry Allen:
1. Historically, major equity selloffs after oil shocks usually require at least one of three triggers: a large and sustained oil spike (+50–100%), a hawkish central bank response, or broader economic damage leading to recession.
2. Today we are closer but not there yet: oil has surged over +50%, but futures markets still expect prices to pull back, suggesting the shock may be temporary.
3. Policy and growth risks remain limited for now: markets price slightly more hawkish rates, but central banks haven’t shifted policy, and economic data is mixed rather than recessionary.
Chart shows crude 1 and 6 mths futures in % over the past year.
Source: LSEG Workspace
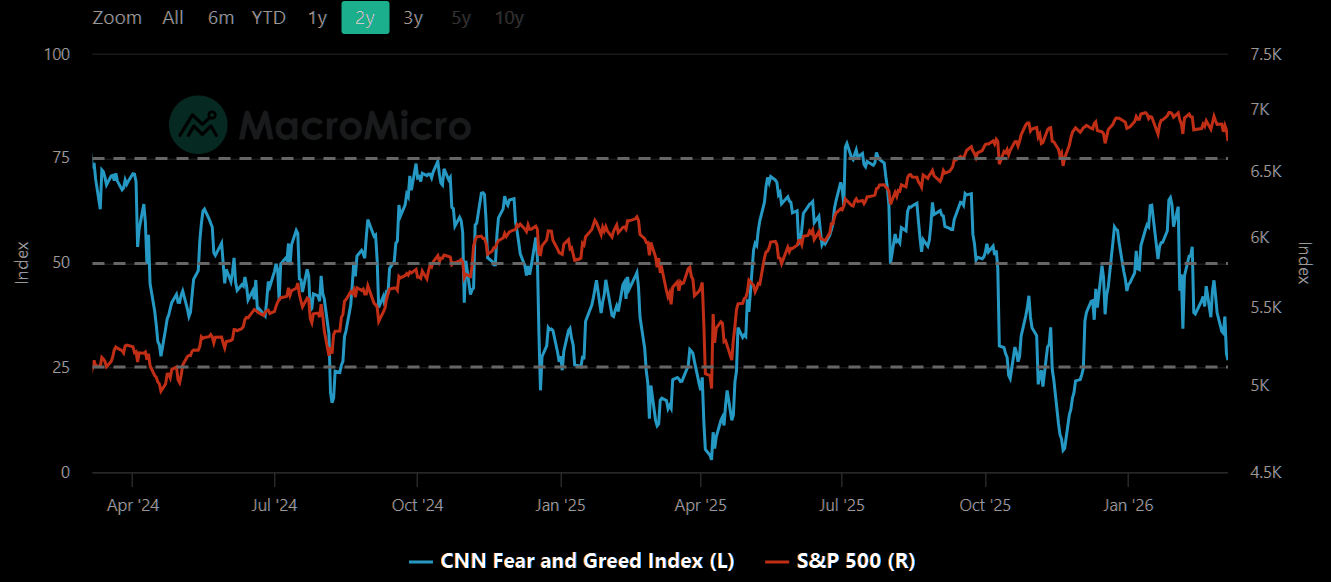
Hello old friend
Say hello to extreme fear. Haven’t seen you since December, but extreme can always get more extreme.