Gold on the Edge - $3900 or Bust
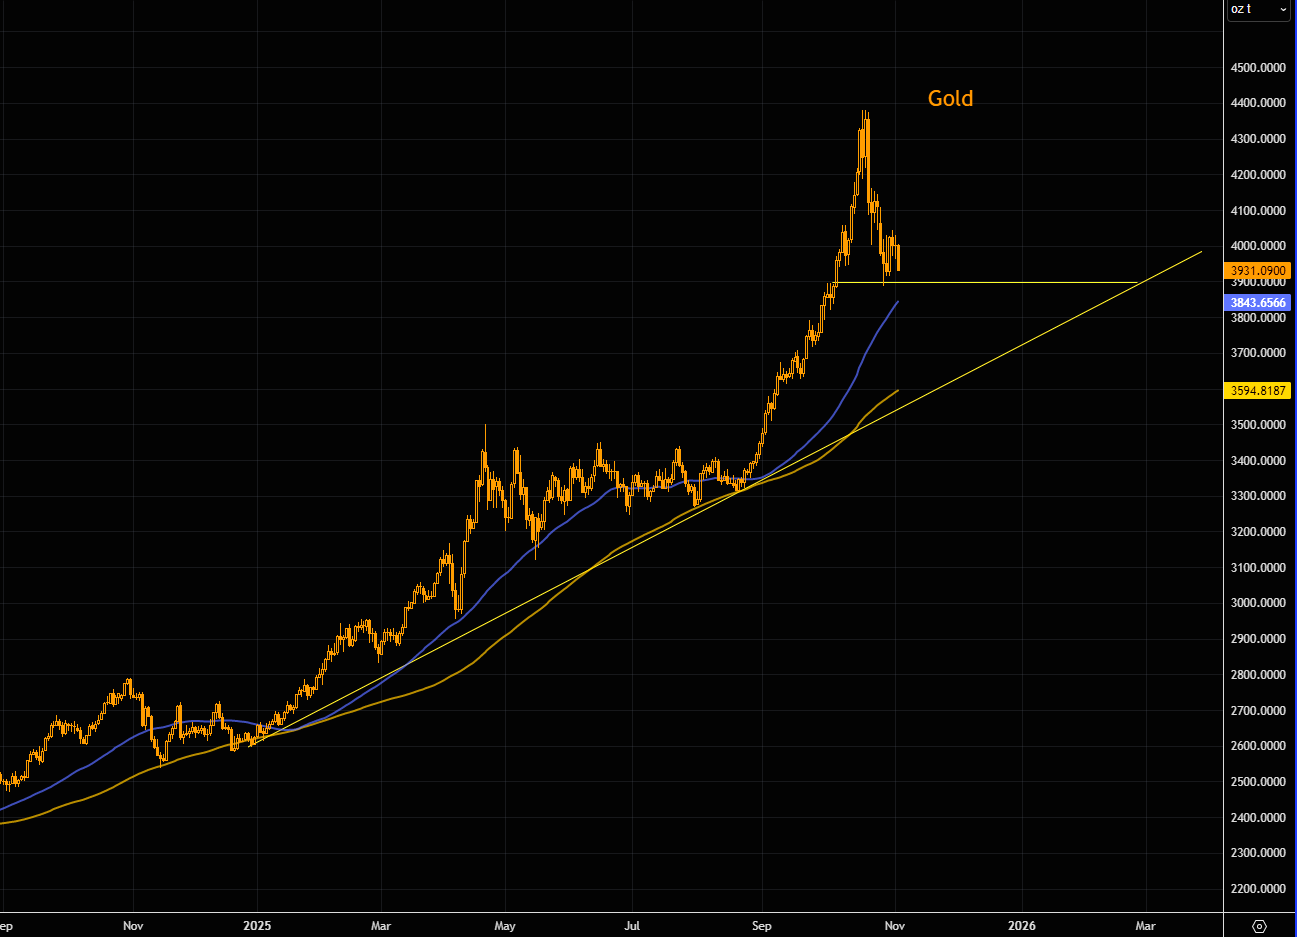
Watching $3900
Gold putting in another big down candle. $3900 is the line in sand level to watch (50 day comes in slightly lower). A close below that area and things could accelerate further to the downside. 100 day and the longer term trend line comes in around the $3600 area.
Source: LSEG Workspace
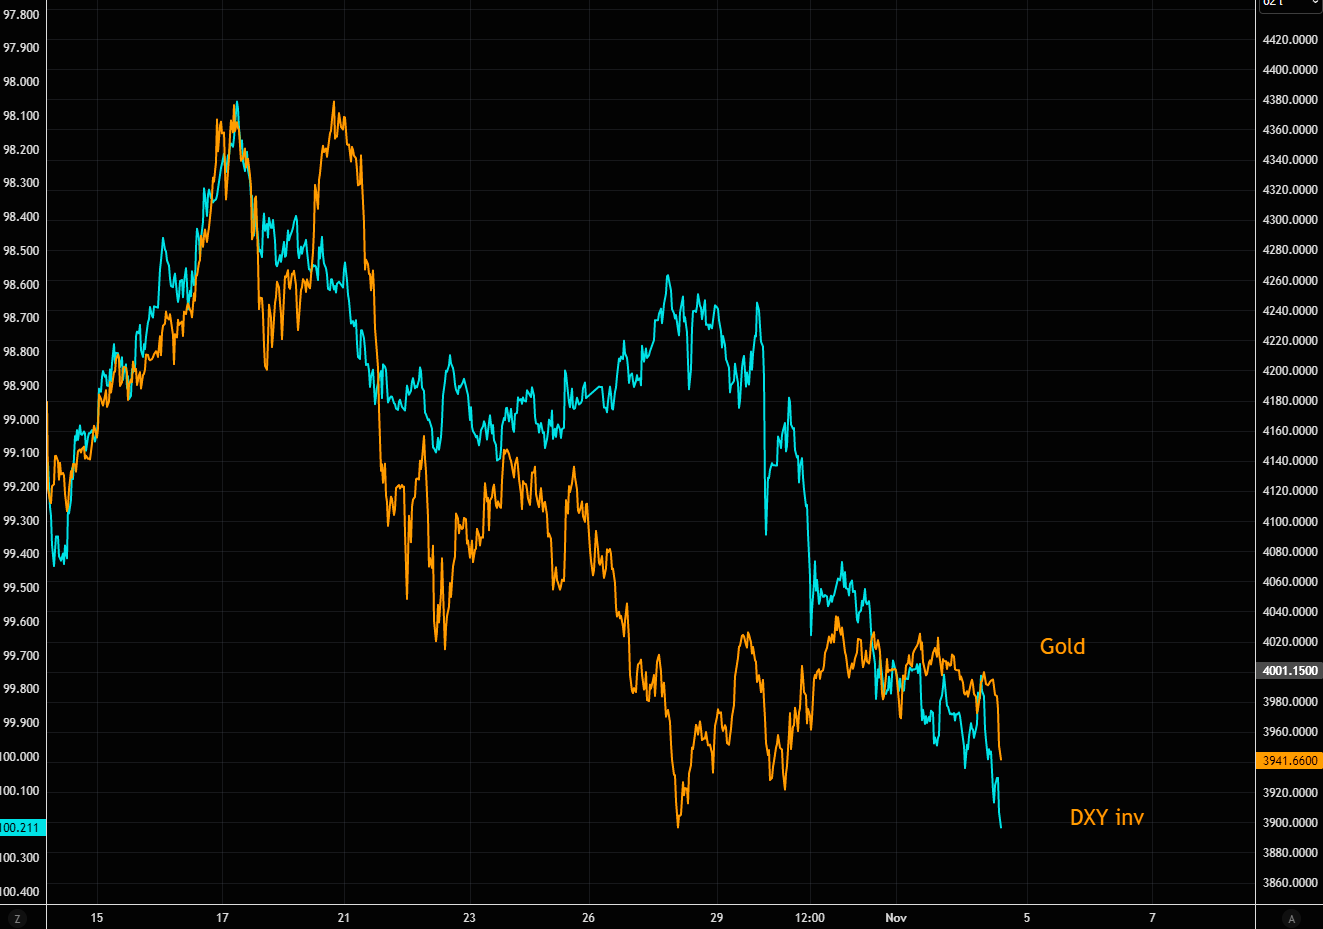
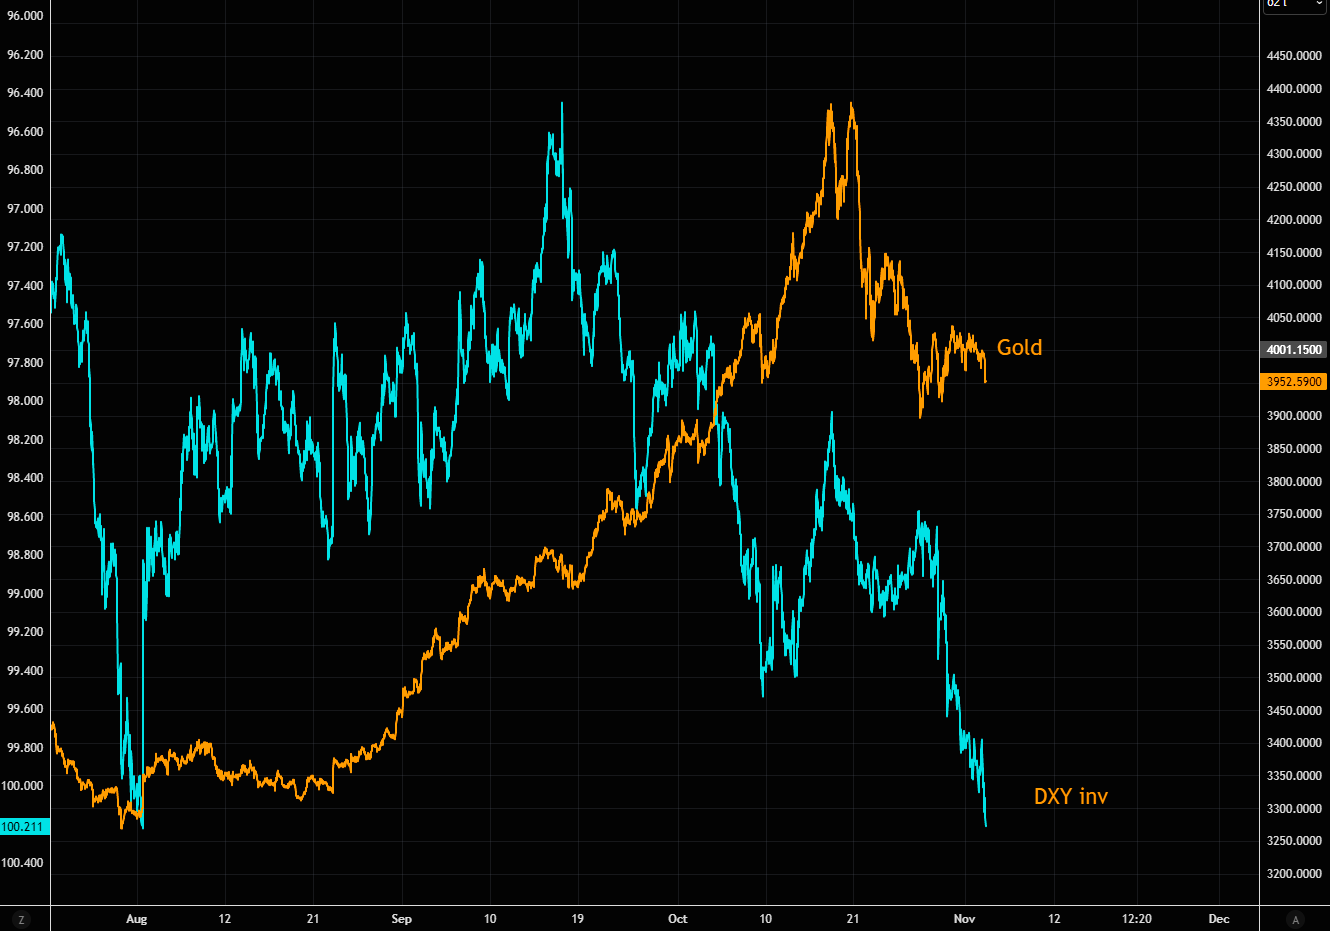
Following the dollar
Gold has moved in close tandem with the dollar over the past weeks. Chart 2 shows that the last time the dollar traded here, gold was around $3400.
Source: LSEG Workspace
Source: LSEG Workspace
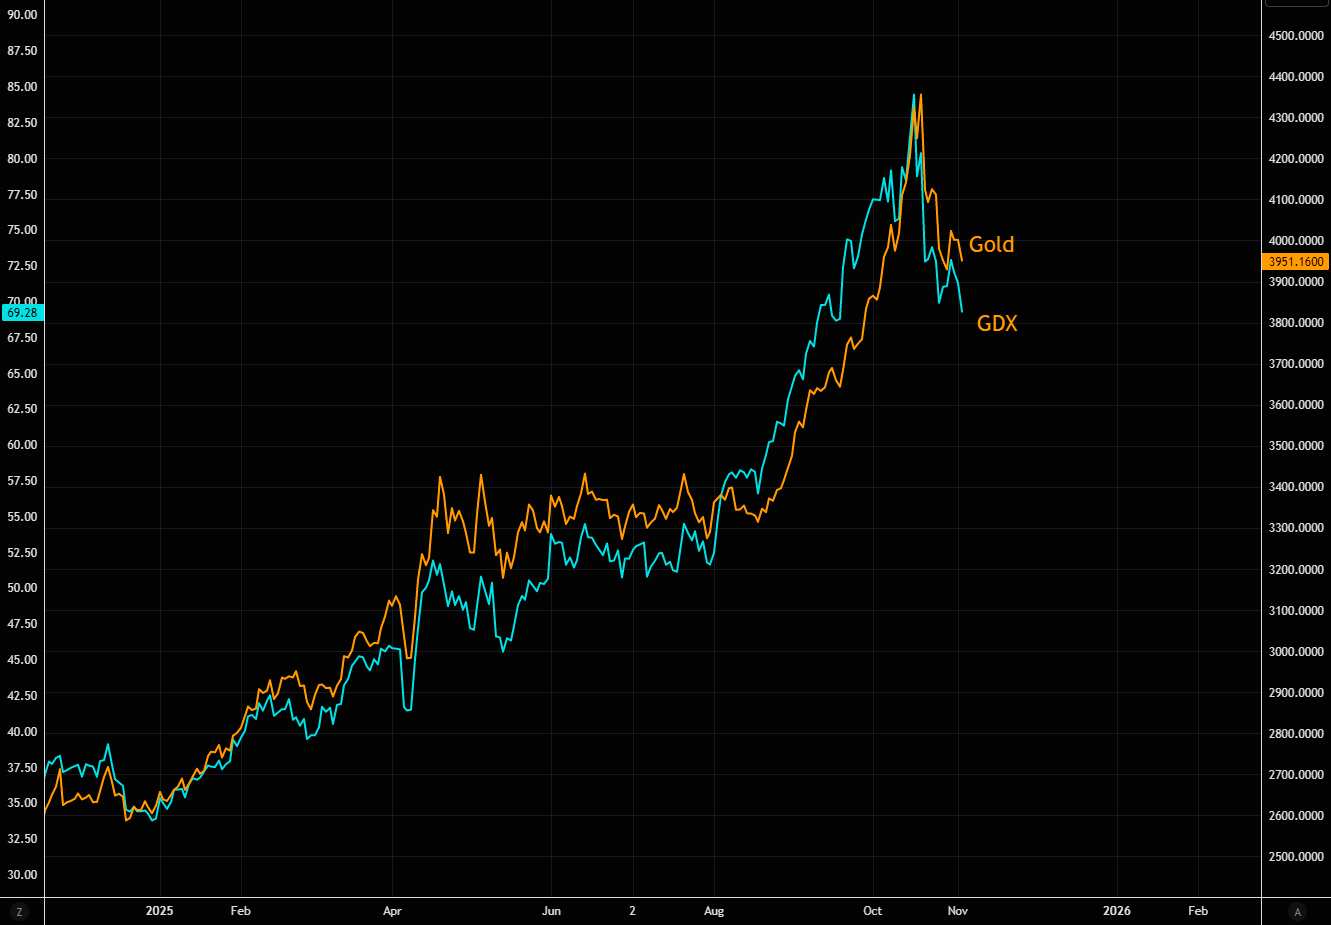
Showing the way?
GDX leading? Last time GDX closed here, gold traded around $3700.
Source: LSEG Workspace
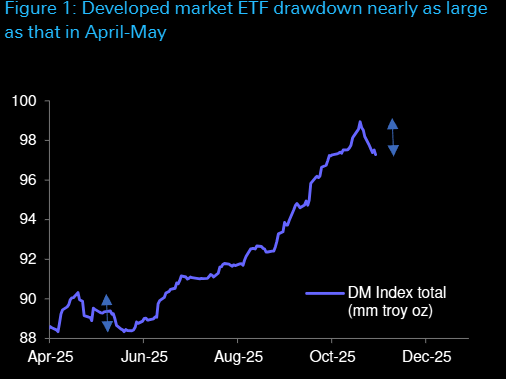
The gold ETF sell
ETF investors have cut holdings in 7 of the past 8 sessions, bringing total reductions to 86% of the drawdown seen during April–May.
Source: DB
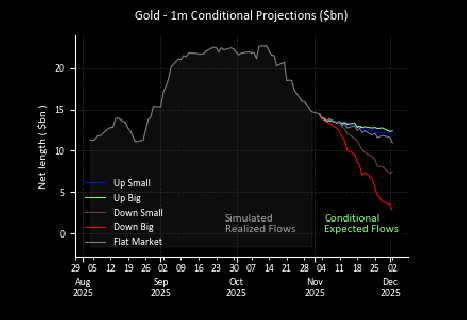
Mechanical gold for sale
CTAs are sellers of gold...
Source: GS
Takes time
Gold is still "struggling" with the after effects of the volatility explosion. This takes time to feed through the system, so expect more erratic moves.
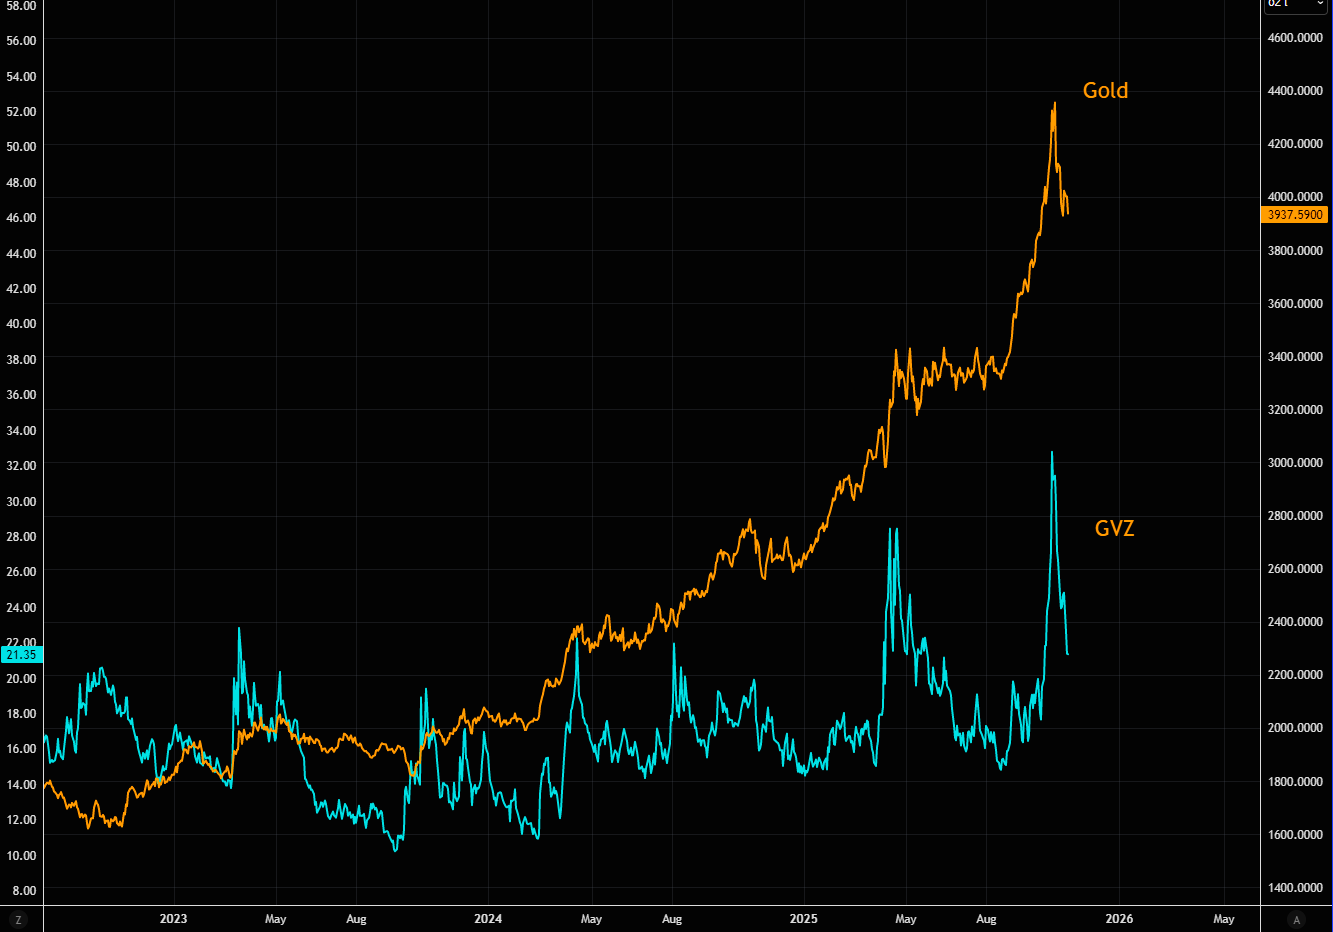
Source: LSEG Workspace
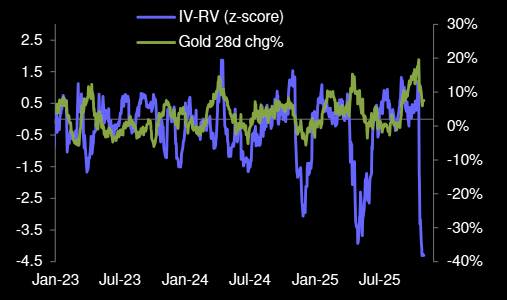
Not all is "healed"
Implied volatility trading well below realized volatility. This makes it problematic for investors to manage gold positions.
Source: DB
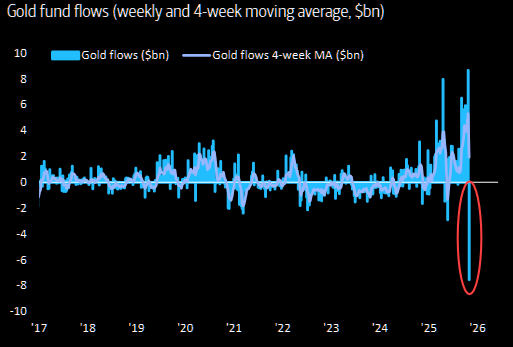
Gold exodus
Big numbers from last week: record $7.5bn outflow in gold… follows $59bn inflow past 4 months.