Gold - "Smart Money" Buys Puts
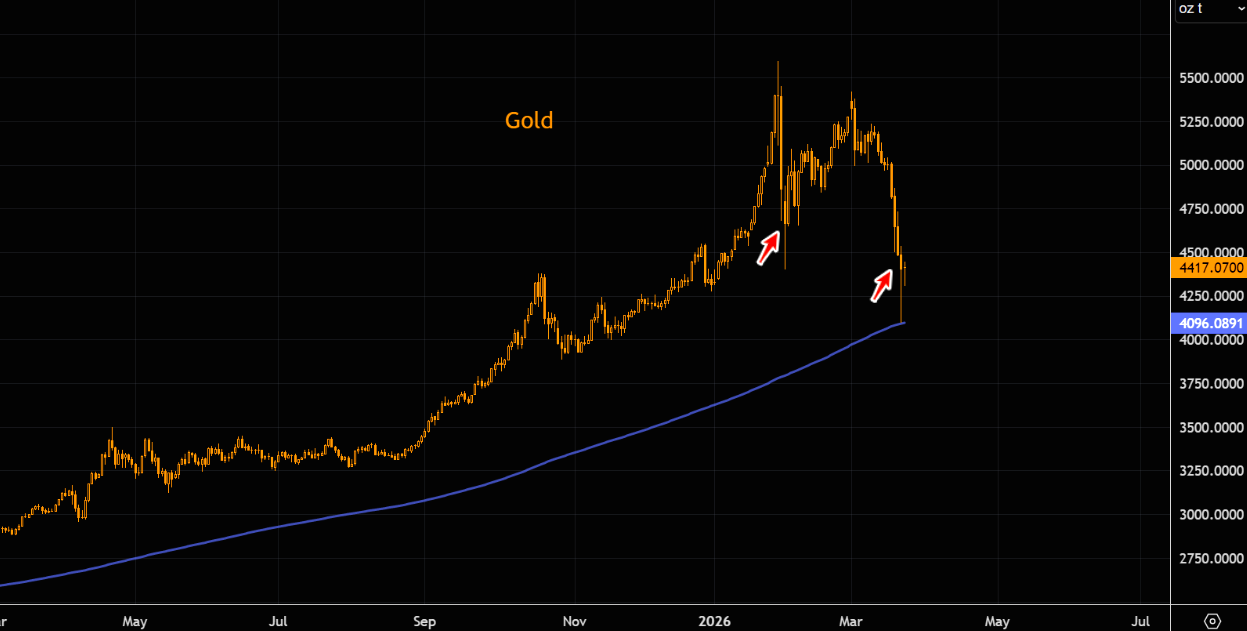
Gold tests the line in the sand
Gold just tagged the 200-day and printed a textbook hammer, but rates are ripping and gold is trading like a risk asset, tracking the inverted US 10 year and EM equities, while flows turn negative and puts flip to a premium.
Source: LSEG Workspace
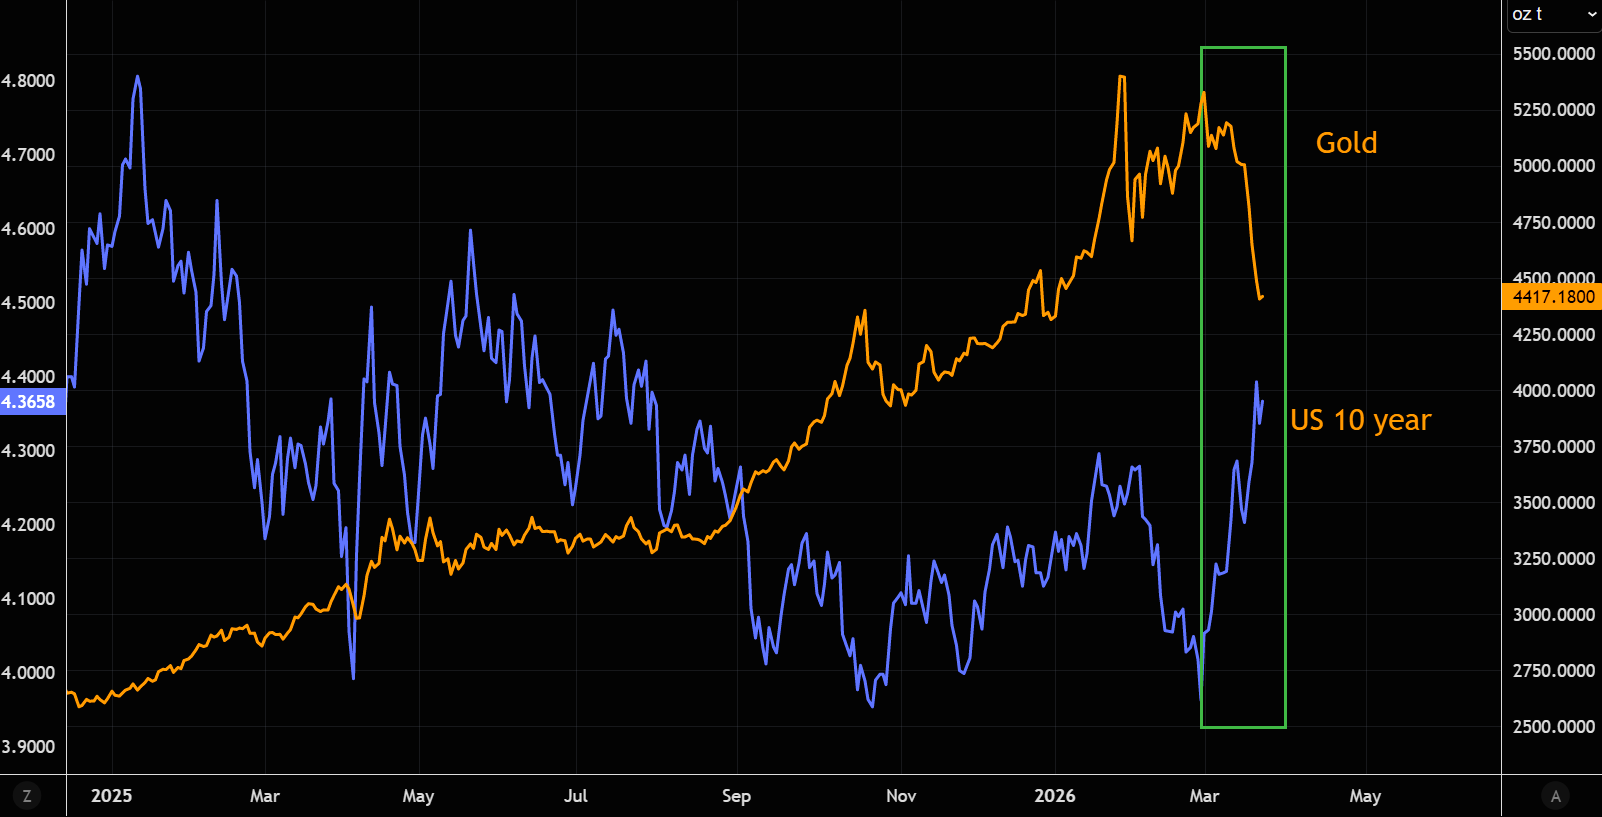
The rates shock
The massive move in rates has been a clear headwind for gold.
Source: LSEG Workspace
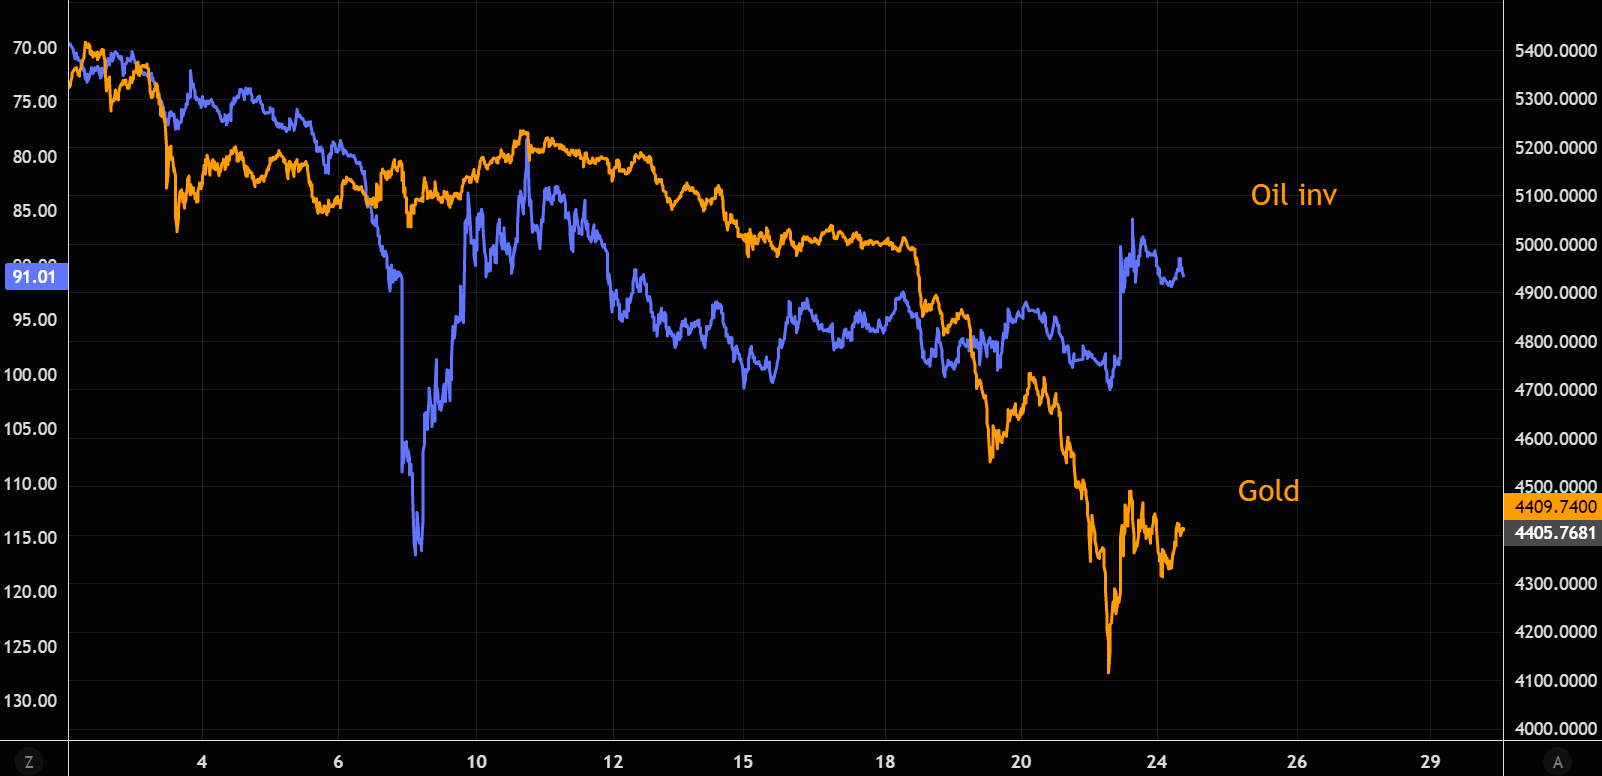
Shiny vs black gold
Gold has been negatively correlated to oil, but note the latest undershot by gold.
Source: LSEG Workspace
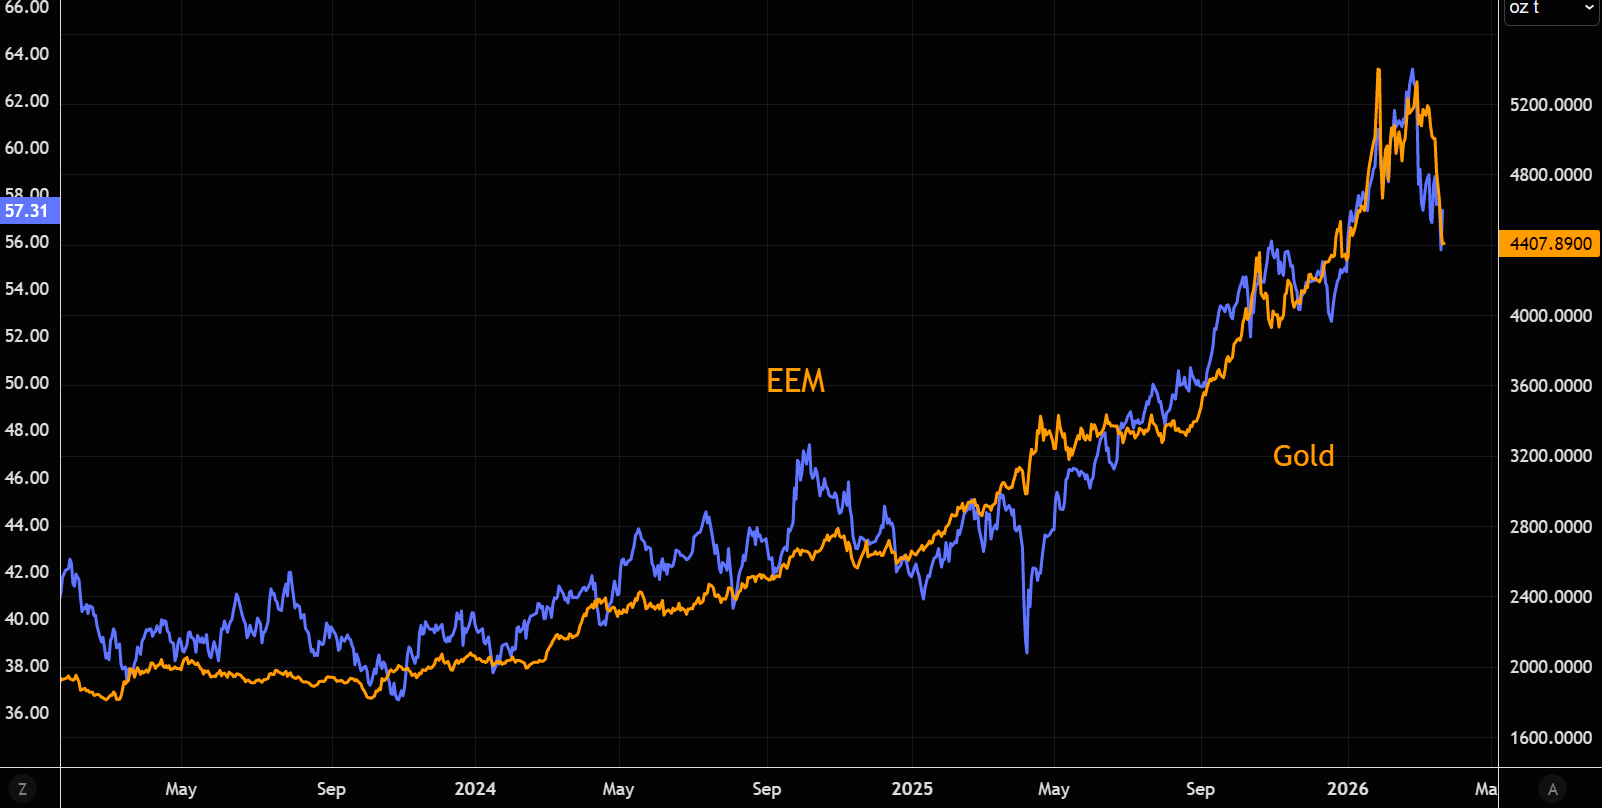
Just another risk sensitive asset?
Gold and EEM have moved in pretty much perfect relationship.
Source: LSEG Workspace
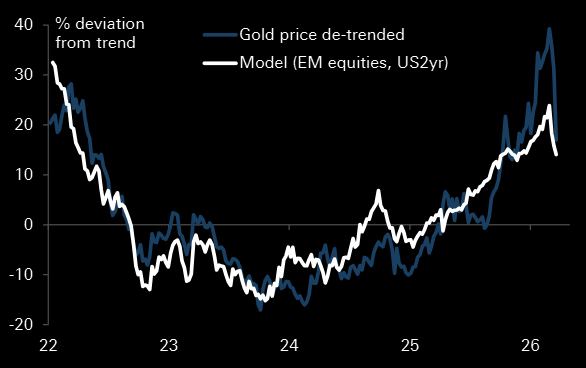
Excess gone
De-trended regression vs yields and EM equities showed gold was ~15% overvalued in late Feb, now only ~2% rich.
Relative to EM equities, gold actually looks slightly cheap at current levels.
The unwind in euphoria and leverage suggests positioning has reset, and gold could be close to finding a base according to DB.
Source: DB
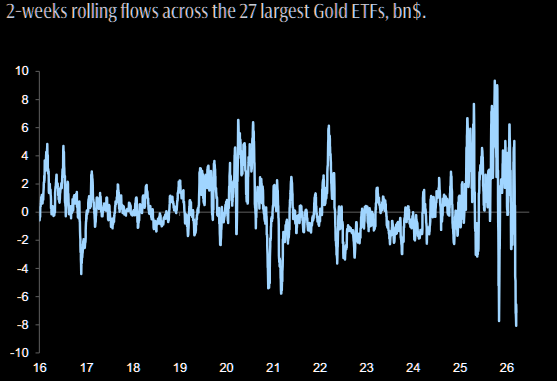
Gold exodus
Massive outflows from gold over the past weeks.
Source: GS
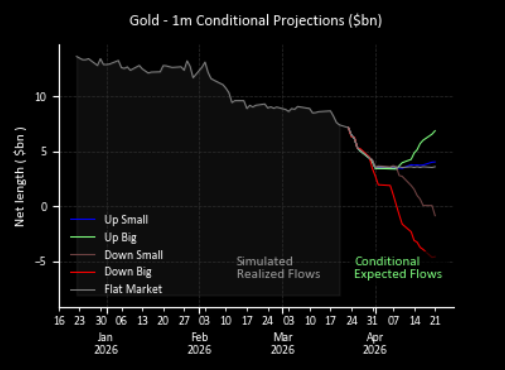
Gold CTA projections
Current net length near median; "Up Big" shows upside potential (green line), "Down Big" implies big downside risk (red line). CTA positioning is no longer as stretched → room to move both ways.
Source: GS
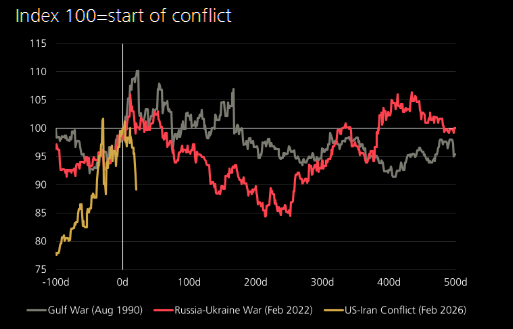
The geopolitical risk factor
The chart shows gold’s performance during phase 1 of conflicts, and it’s not particularly impressive, despite ongoing fear-hedge selling narratives.
Source: UBS
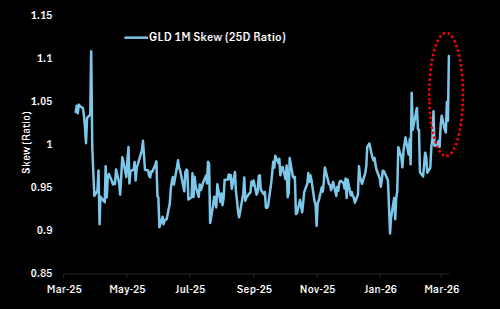
Put hunters
Gold options positioning has shifted sharply as inflation risk picked up, with rising demand for puts. After a year of inverted skew (calls > puts), GLD skew has flipped to a 1-year high, with puts now trading at a premium to calls.
The excess is gone, the hammer is in, and with puts bid, the pain trade leans higher, but if rates keep ripping, gold risks rolling over again.