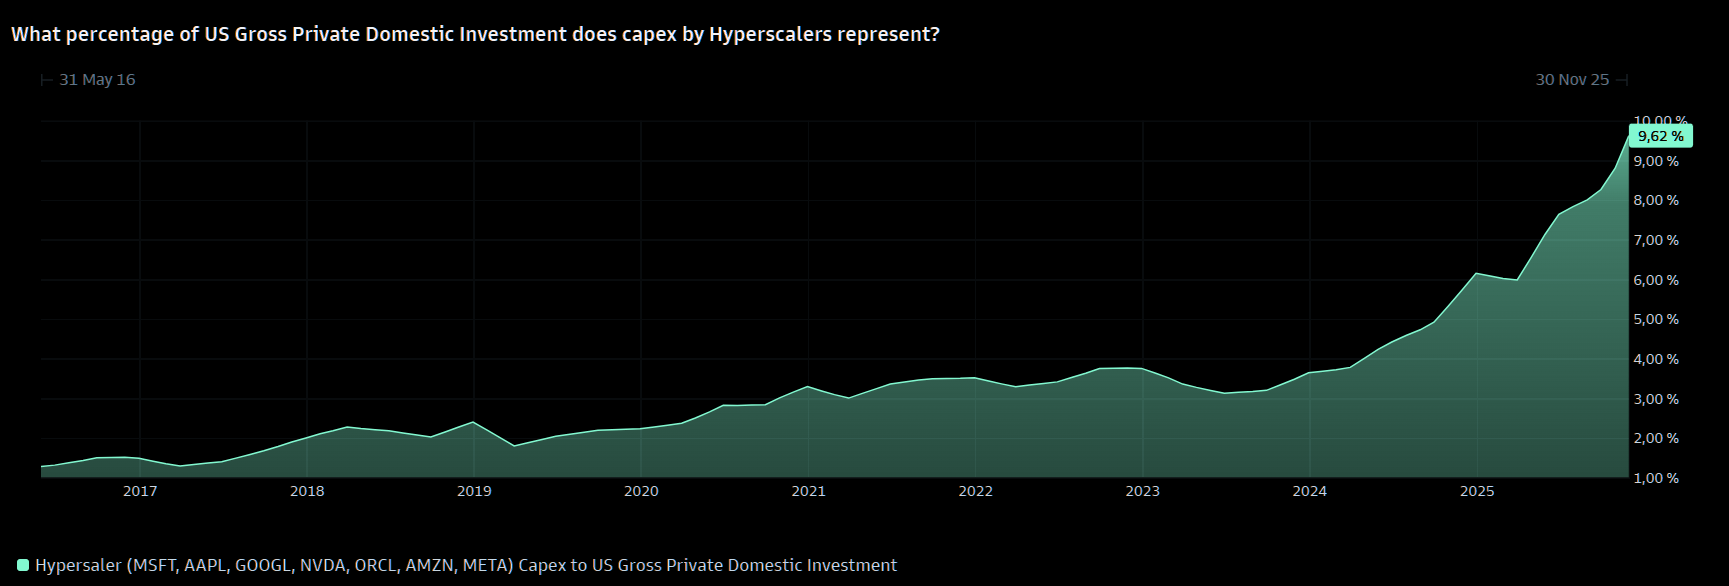
Hyperscaler capex already accounts for ~10% of US gross capital formation
Capex crazy
Everyone of course already knows AI spending is exploding. $700bn per year is nearly the size of the U.S. defense budget and multiples of global pharma R&D. Here is a more detailed look at some of the metrics that matter for the hyperscaler analysis.
Almost 10%
Last year, hyperscaler capex already accounted for ~10% of US gross capital formation and the number will only increase this year.
Source: Marquee
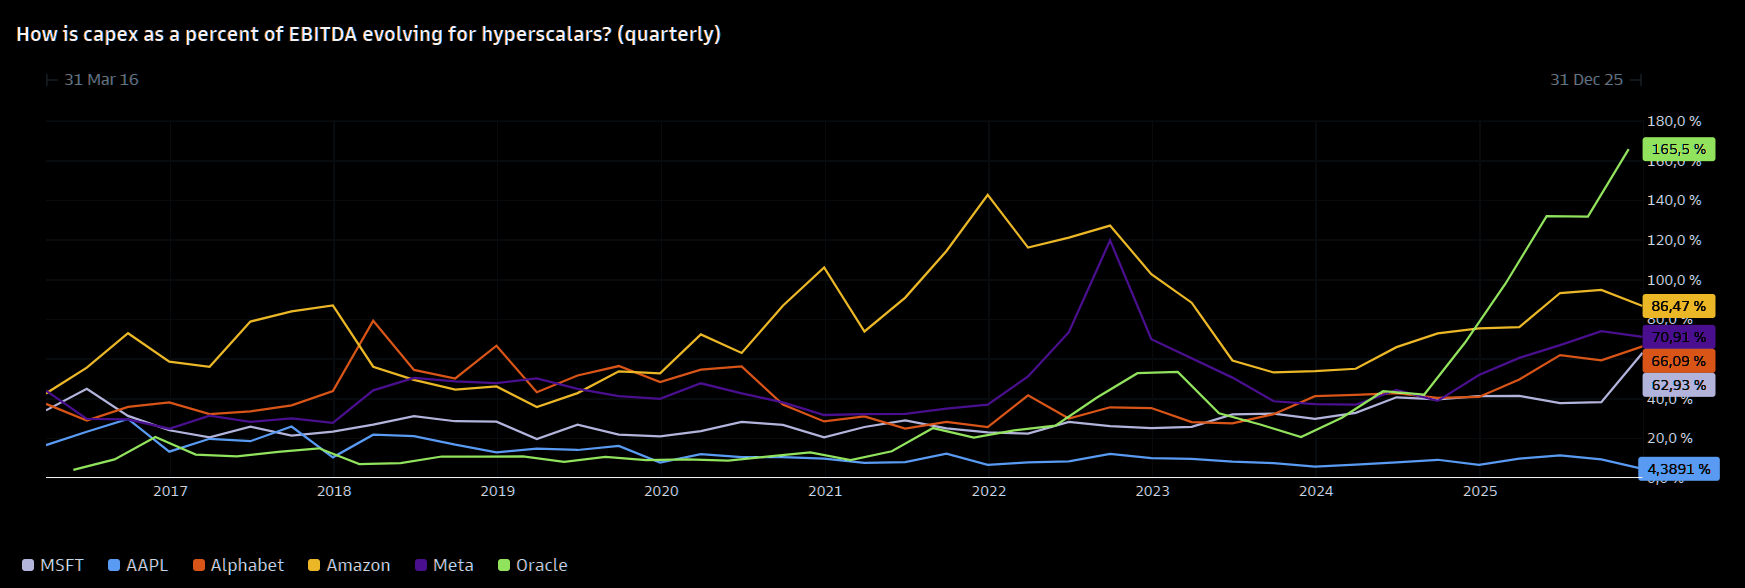
Capex-to-EBITDA
Capex-to-EBITDA is rising across hyperscalers and is likely to remain elevated as AI and data-center buildouts continue. More companies are turning to credit markets to fund incremental spending.
Source: Marquee
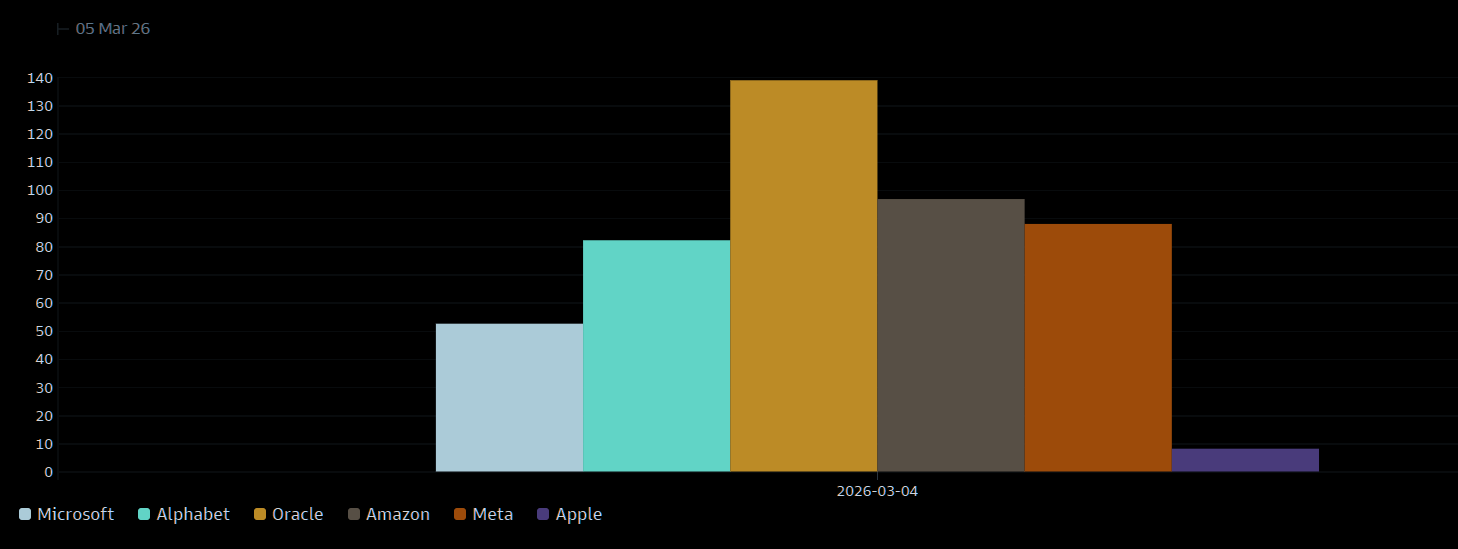
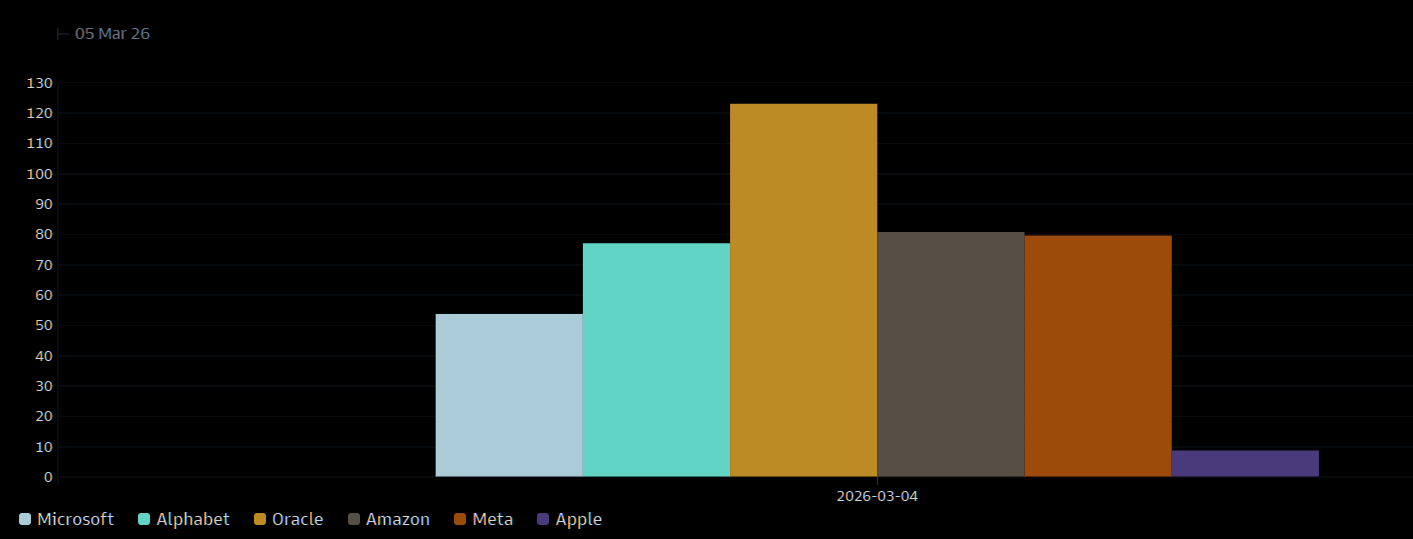
More on that capex vs EBITDA
Analyst estimates for capex to EBITDA of hyperscalers for 2026 (%).
Source: FactSet
2027
Same numbers as before but now for 2027.
Source: FactSet
Interest coverage ratios
Analyst estimates for EBITDA less capex interest coverage ratio for 2026 and 2027 have been revised downward but still healthy (Except ORCL). Companies are able to top the market with low spreads and established business.
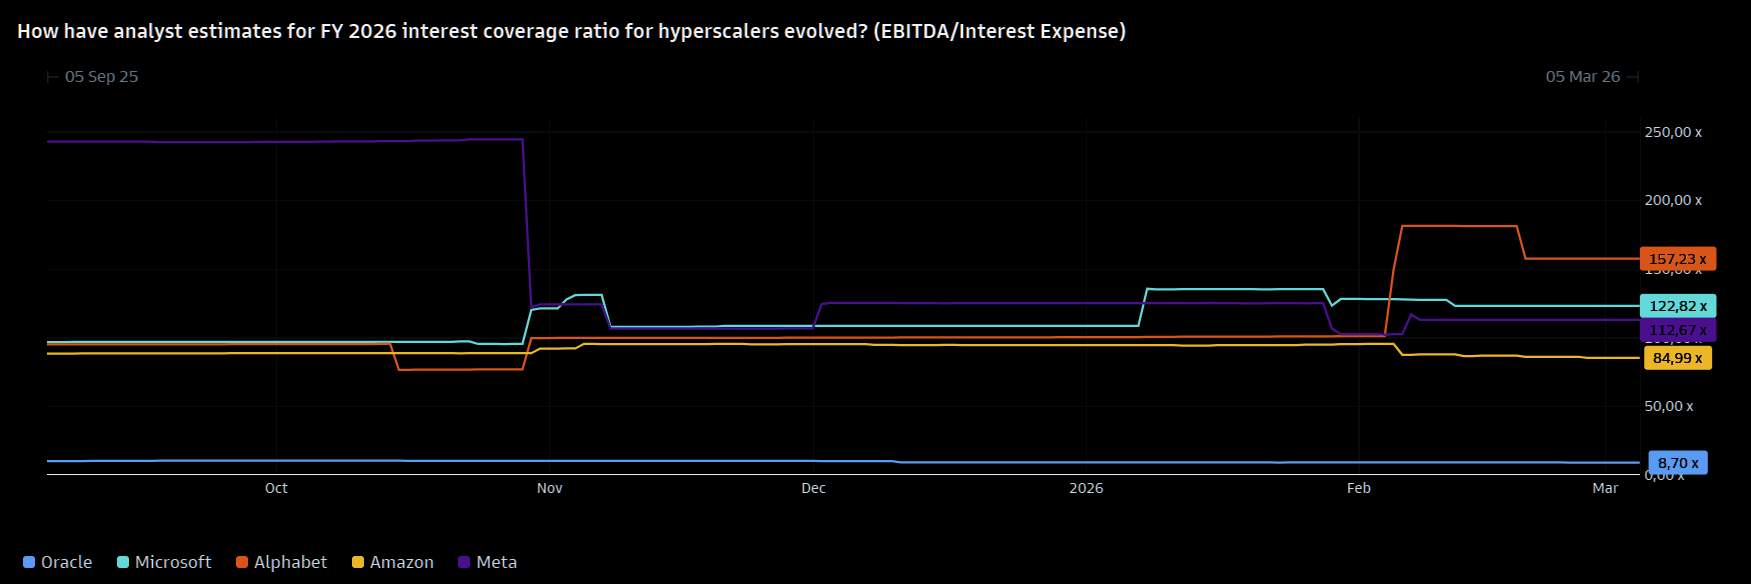
Source: Marquee
Depreciation
How have big tech's depreciation expense and capex evolved? (quarterly $bn).
(Meta, MSFT, AMZN, Apple, Alphabet & ORCL).
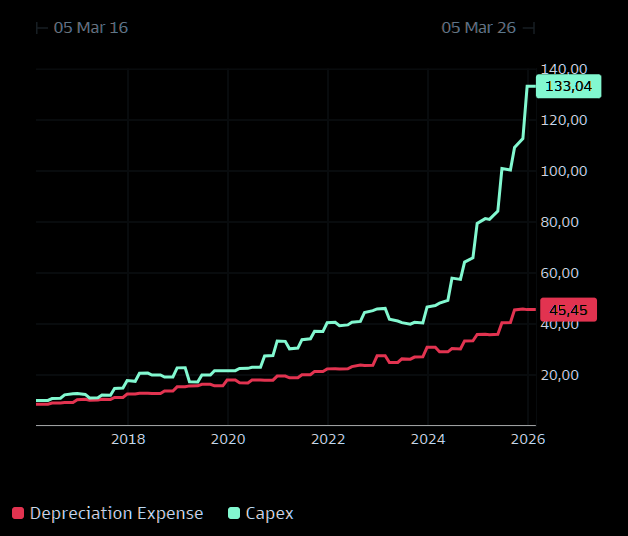
Source: Marquee
The view from the credit markets
GS: "Credit performance across the hyperscalers has widened marginally over the past three months. Real money is still underweight credit providing relatively easy absorption of high quality hyperscaler debt."
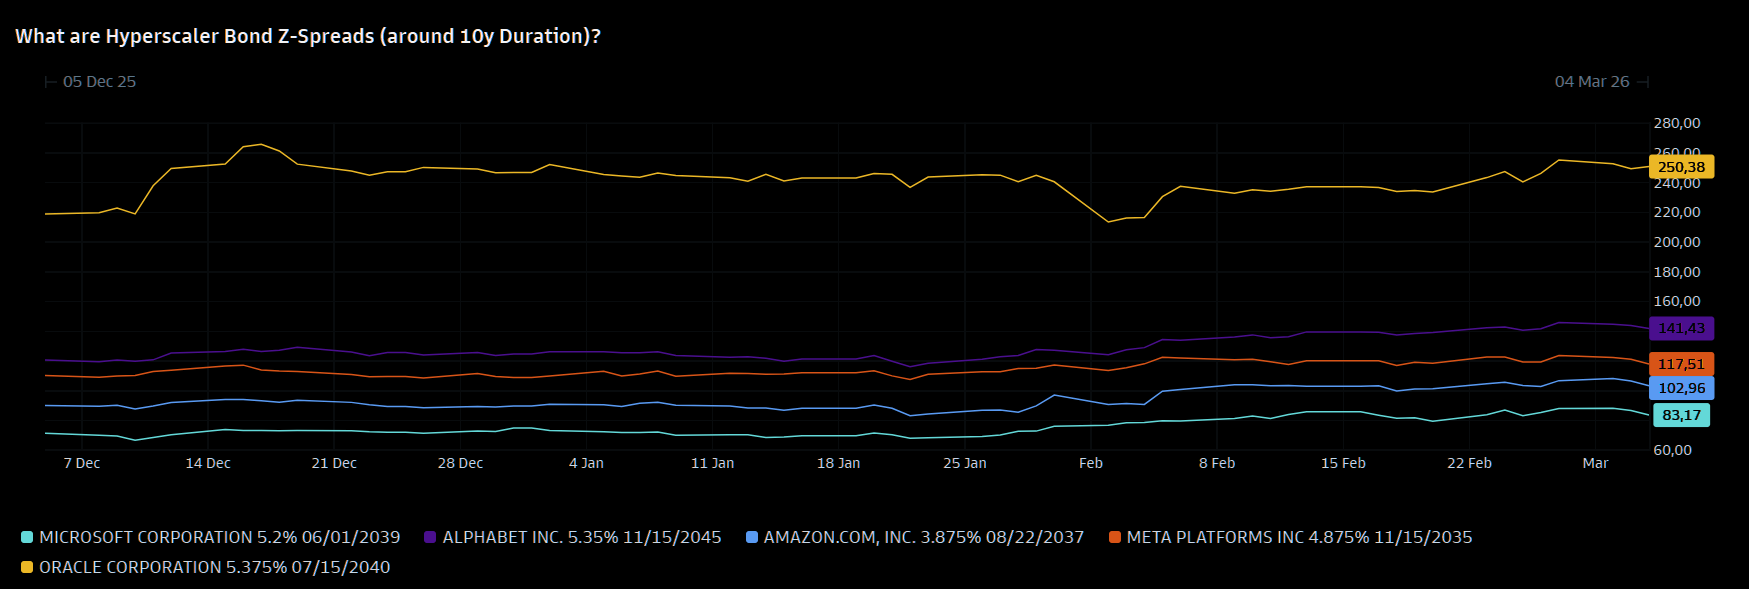
Source: GS credit trading desk
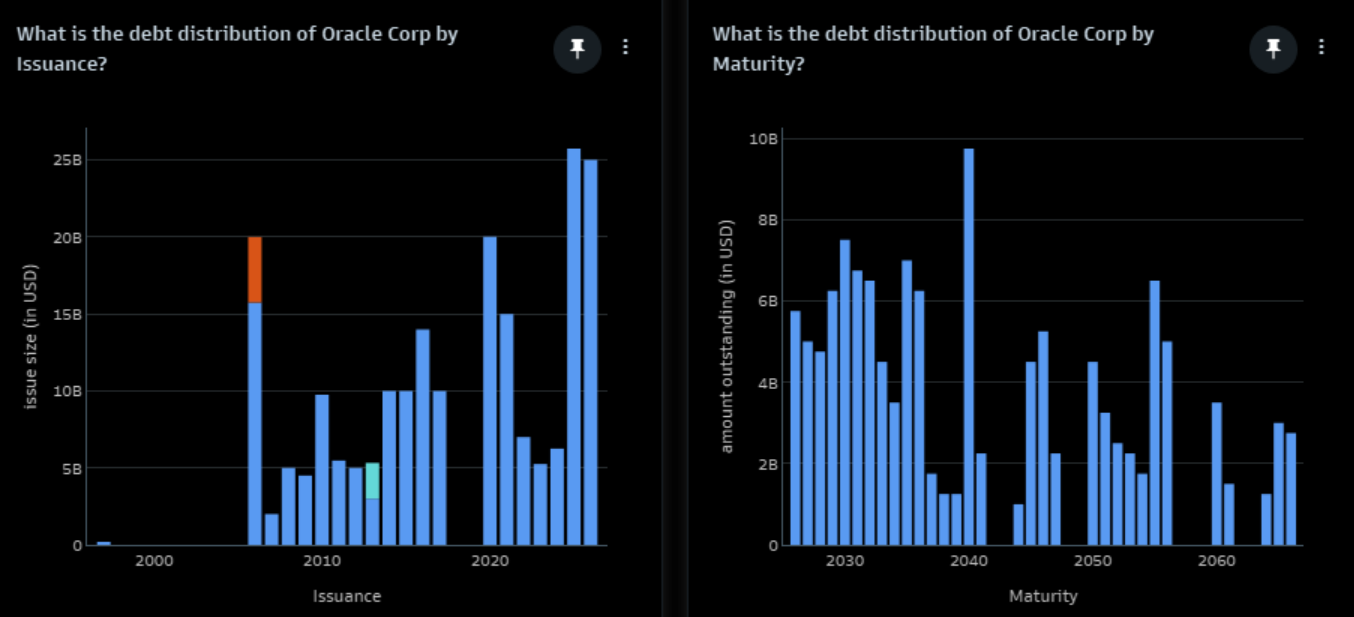
ORCL
Oracle has also issued an additional $25bn deal following last year’s $25bn. Here is the historic debt issuance as well as maturity profile.
Source: GS FICC
More on ORCL
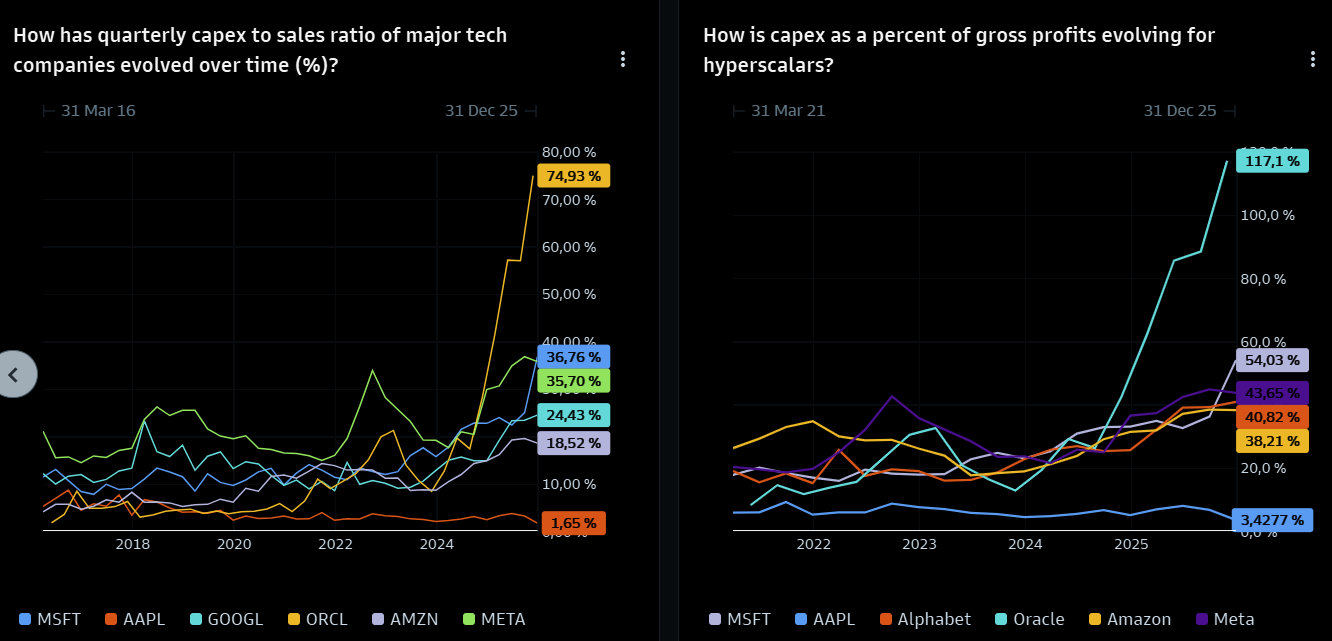
ORCL also stands out as the craziest capex king when measuring vs. sales and profit.