If You Believe in Voodoo and Small Quant Studies
WWIII wipe-out
World War 3 has wiped out the equivalent of the entire economies of Germany, Japan, and the UK combined (=$12 trillion from global markets). Total S&P 500 losses since the Iran War began now register at -$4.8 trillion. Sounds like a lot even though you can hardly see it on the chart... It is hard to compartmentalize that we would be at some rock bottom capitulation low when we are not even off 10% in S&P500 - but here are 10 not so fundamental reasons why we should be close to a bottom.
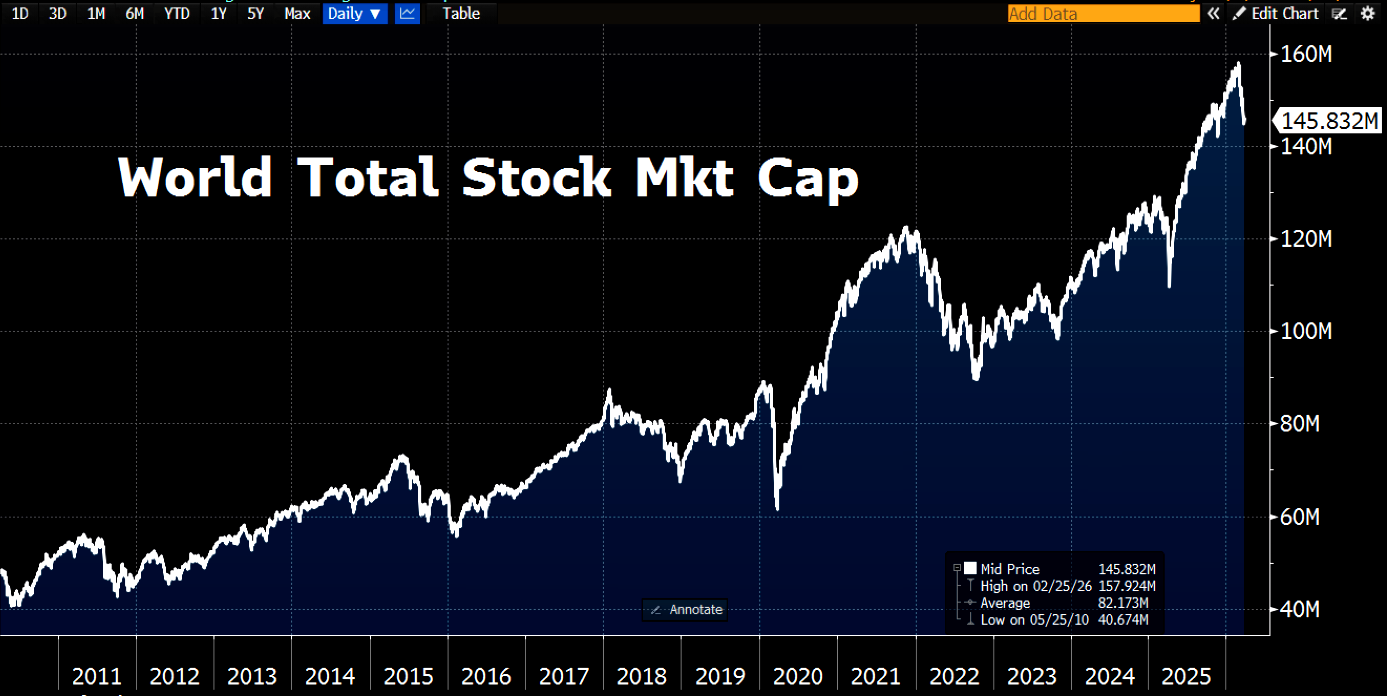
Source: Bloomberg
1 - Worst war ever
S&P500 is performing much worse than "normal" during a geopolitical conflict. Sell-offs on war do normally bottom out around here (or actually a little earlier...).
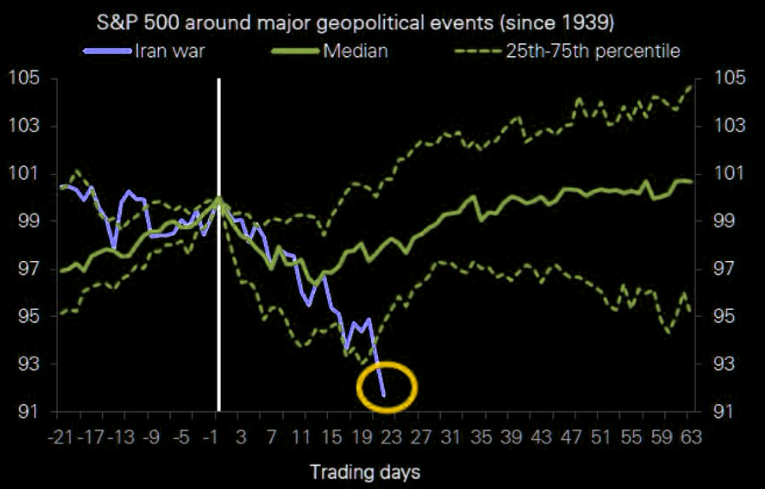
Source: Deutsche Bank
2 - Seasonal voodoo
If you believe in seasonality voodoo, then this is plus: April has historically been a strong month for stocks, averaging +1.35% since 1950.
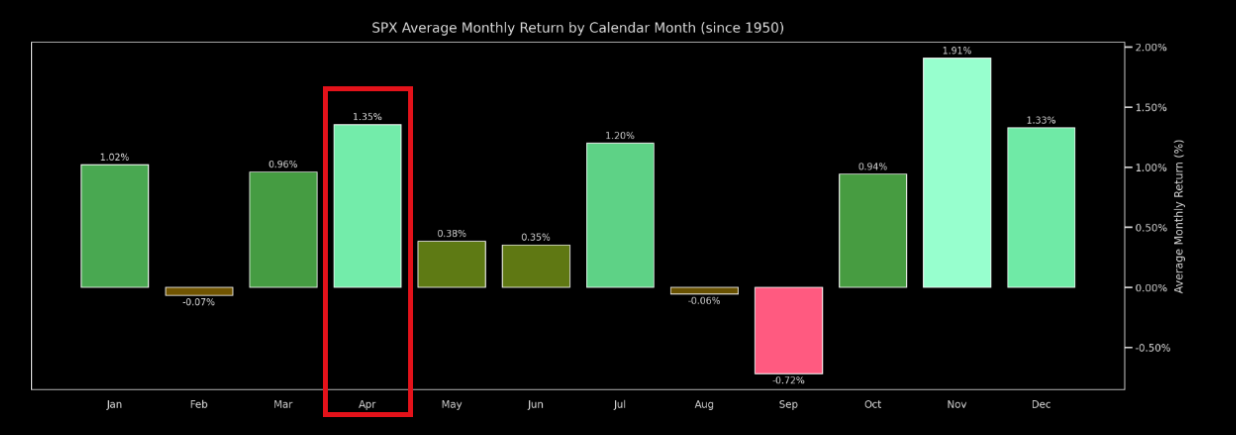
Source: GS
3 - Fear normally seen close to the bottom
Over the last 15 years, when fear and greed index is at 10 or less, the majority of the time we were either at the bottom or getting close to it.
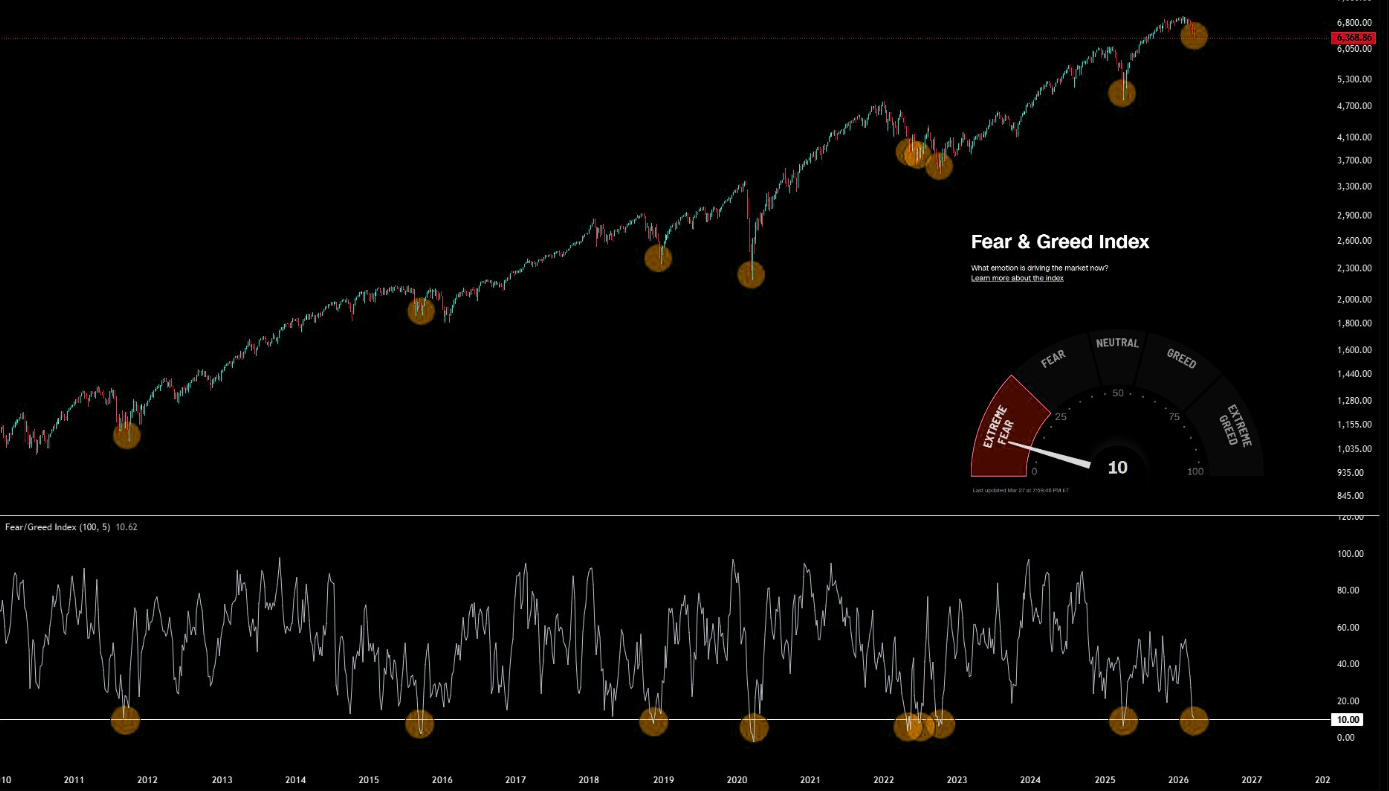
Source: @cantonmeow
4 - Weekly RSI near 10
SPX 5 straight red weeks. Weekly RSI near 10.
"Doesn’t happen often. And when it does, it’s not the start of a crash… it’s usually the tail end of a move... This kind of downside pressure shows up late, not early."
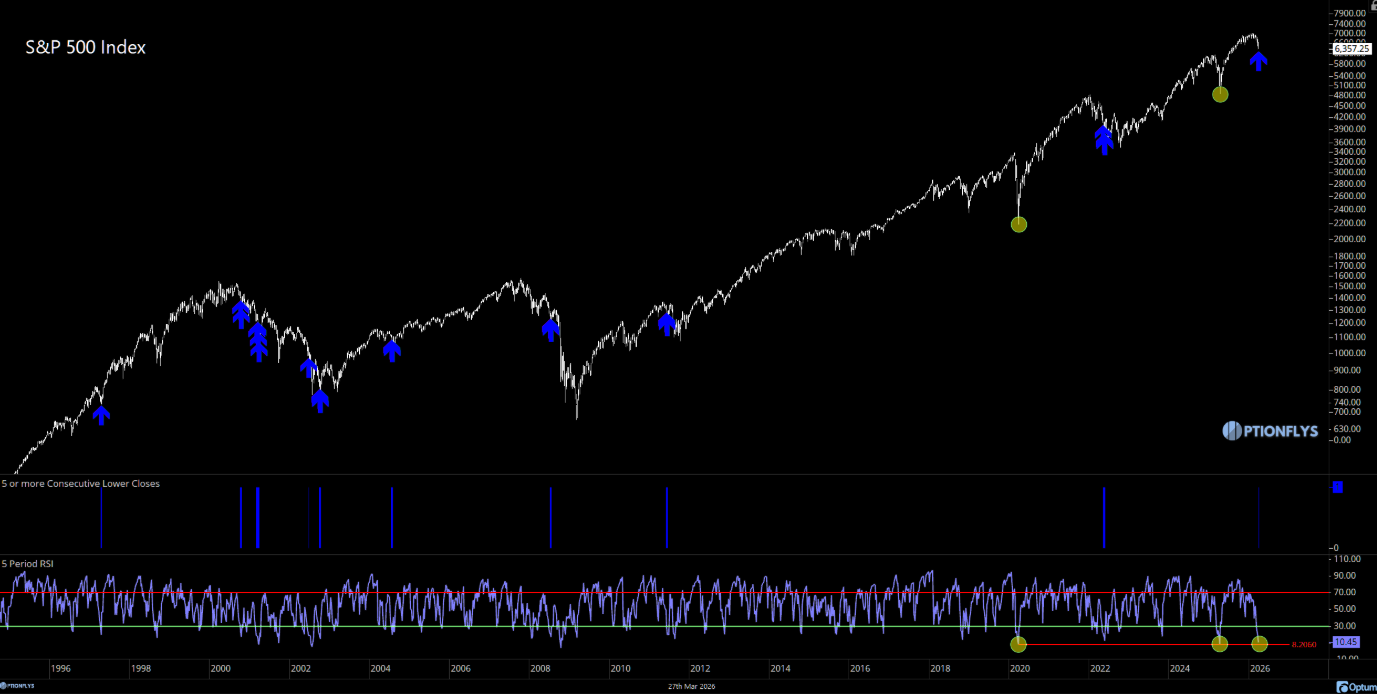
Source: @optionflys
5 - 0%
0% of S&P Financials are above their 50-day EMA. This has only occurred near end of major drawdowns in 2018, 2020, and 2022. Each of the three times, (yes N = 3...) S&P 500 was higher over next 2 months and delivered double digit gains over the next 12 months.
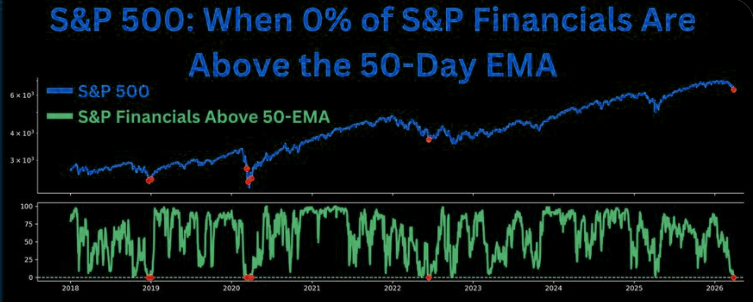
Source: Seth Golden
6 - Back to Liberation Day lows
S&P 500's Daily Sentiment Index is at 15, the lowest since last April.
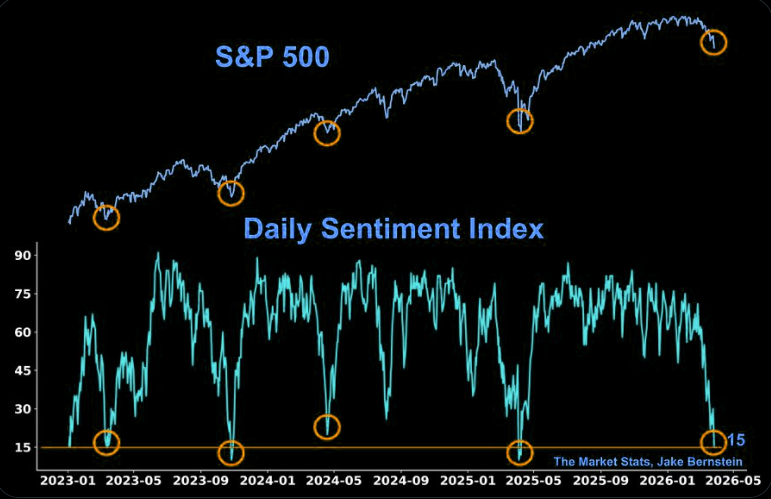
Source: The Market Stats
7 - Month-end buying
US pensions are modeled to BUY $19bn of US equities for month-end (89th percentile).
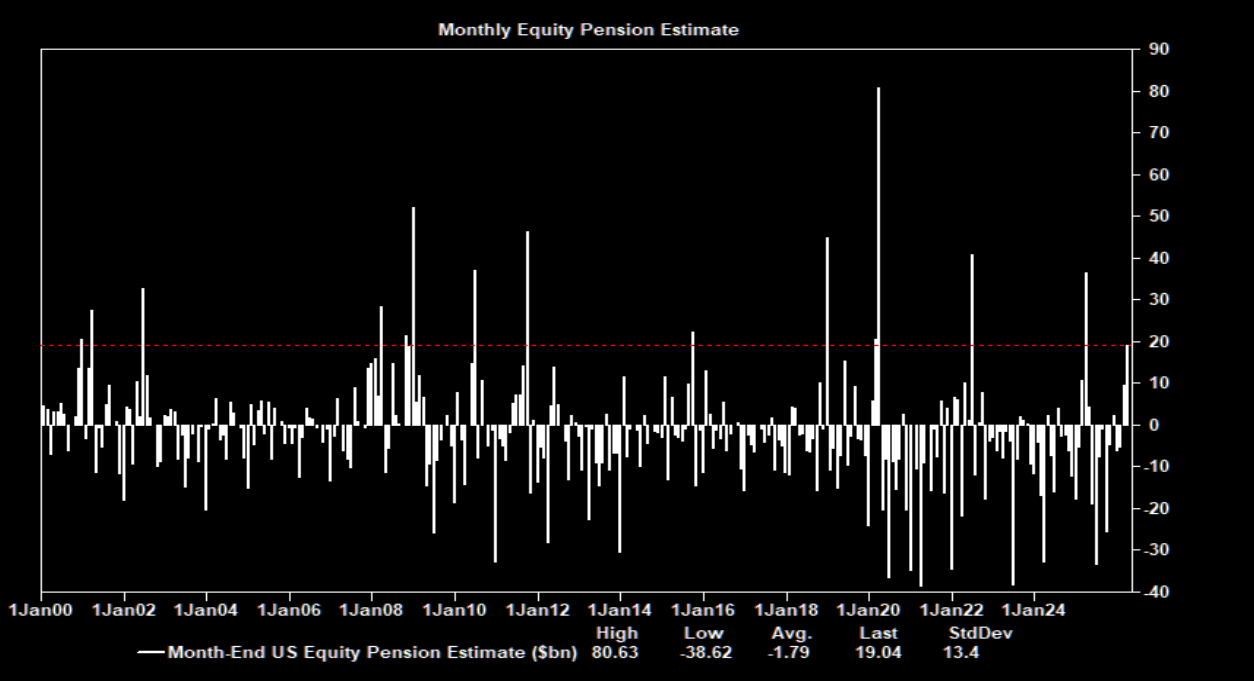
Source: Cullen Morgan
8 - Systematic steam
The systematic community is running out of steam.
GS: "Through Thursday’s close, we estimate that this cohort has sold -$85bn of US equities over the last 30 sessions. We now have CTAs short -$37bn here. Asymmetry lives to the upside -- over the next month, we estimate CTAs are buyers in every scenario."
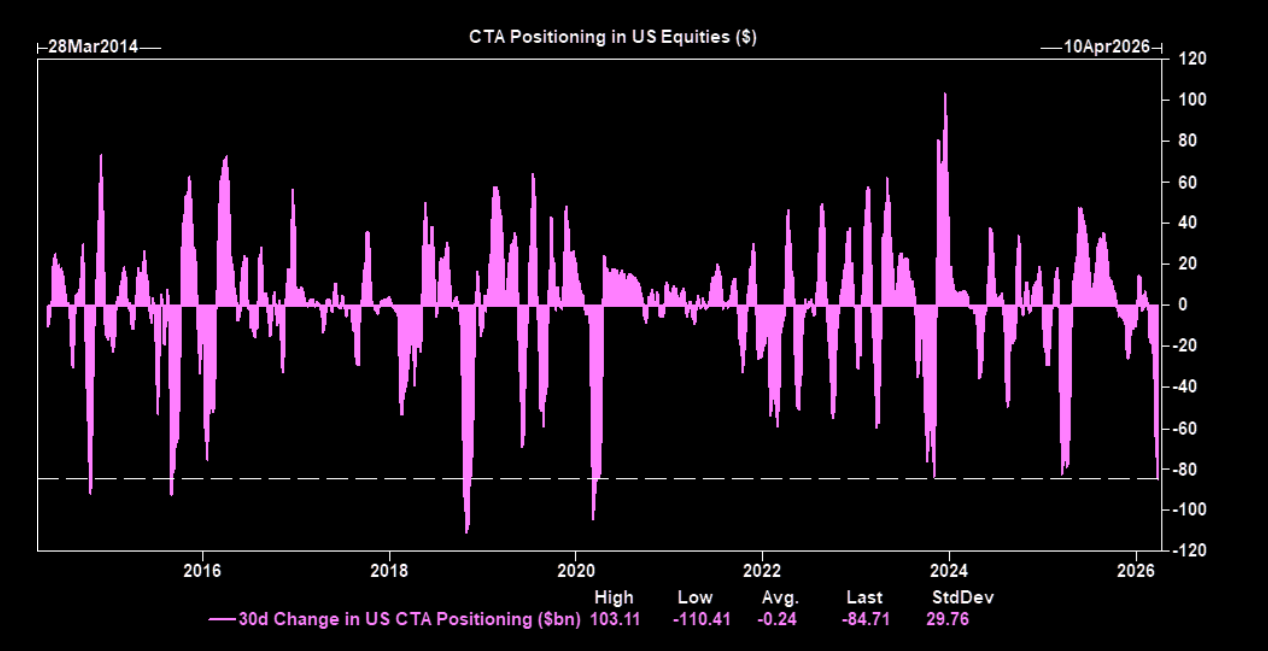
Source: GS PT desk
9 - De-levered
US L/S hedge fund Net leverage fell -3.1 pts – the sharpest weekly reduction since early Apr ’25 (week of Liberation Day) – to 50.6% (22nd percentile one-year).
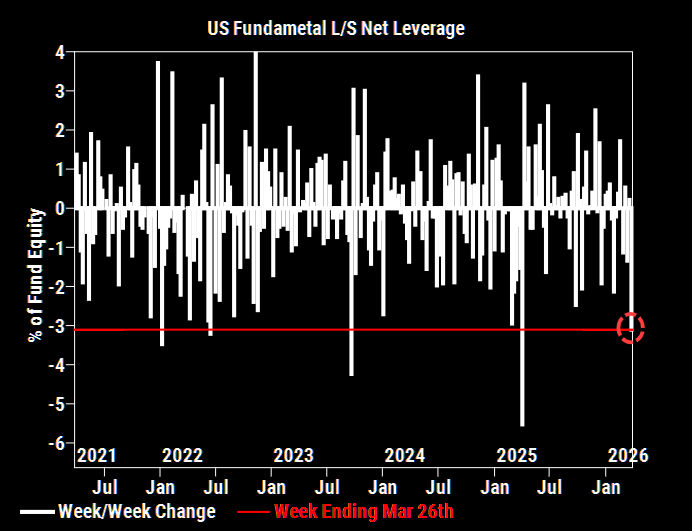
Source: GS Prime
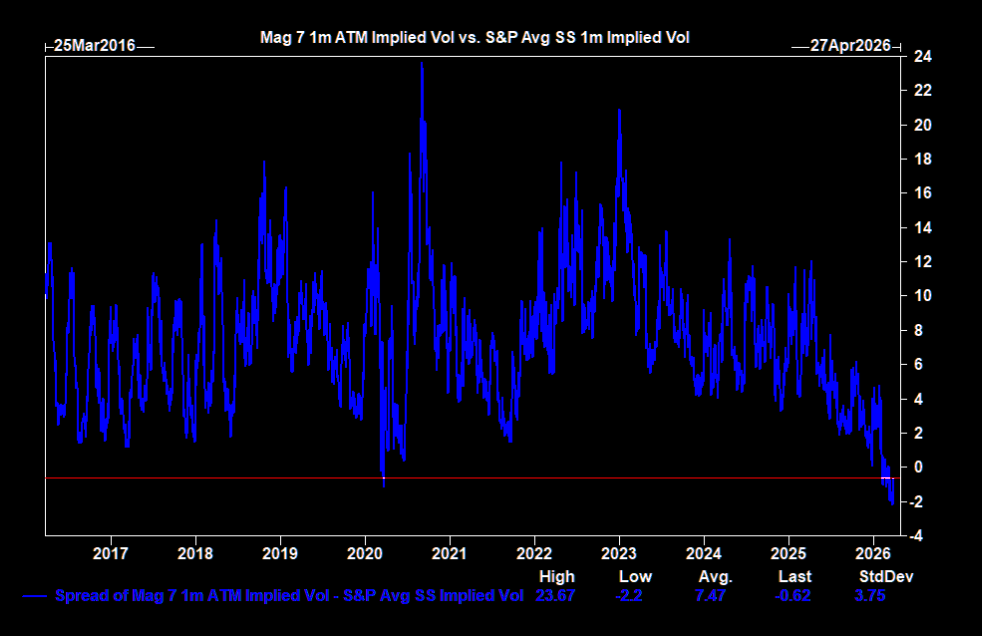
10 - Only seen in March 2020
Given their weighting in the index and importance to the market’s earnings overall, it’s surprising to see Mag 7 vols trade at a collective discount vs. the rest of the S&P single stock options market – something we’ve only seen in March 2020