Markets Are Finally Pricing Fear… But The Fast Money Has Already Sold
Fear is building
Volatility is finally starting to show real stress across markets. Equity volatility is rising, bond volatility is exploding, and hedging activity is concentrating at the very front end of the VIX curve. From European equities to EM stress and rates volatility, fear signals are flashing across asset classes.
The key question now: is this the start of a broader panic phase, or are markets already discounting too much short-term downside?
The bull in fear
VIX hasn’t closed this high since the Iran conflict began. VVIX is firm as well, although it still sits below the initial panic highs we saw when the crisis first erupted.
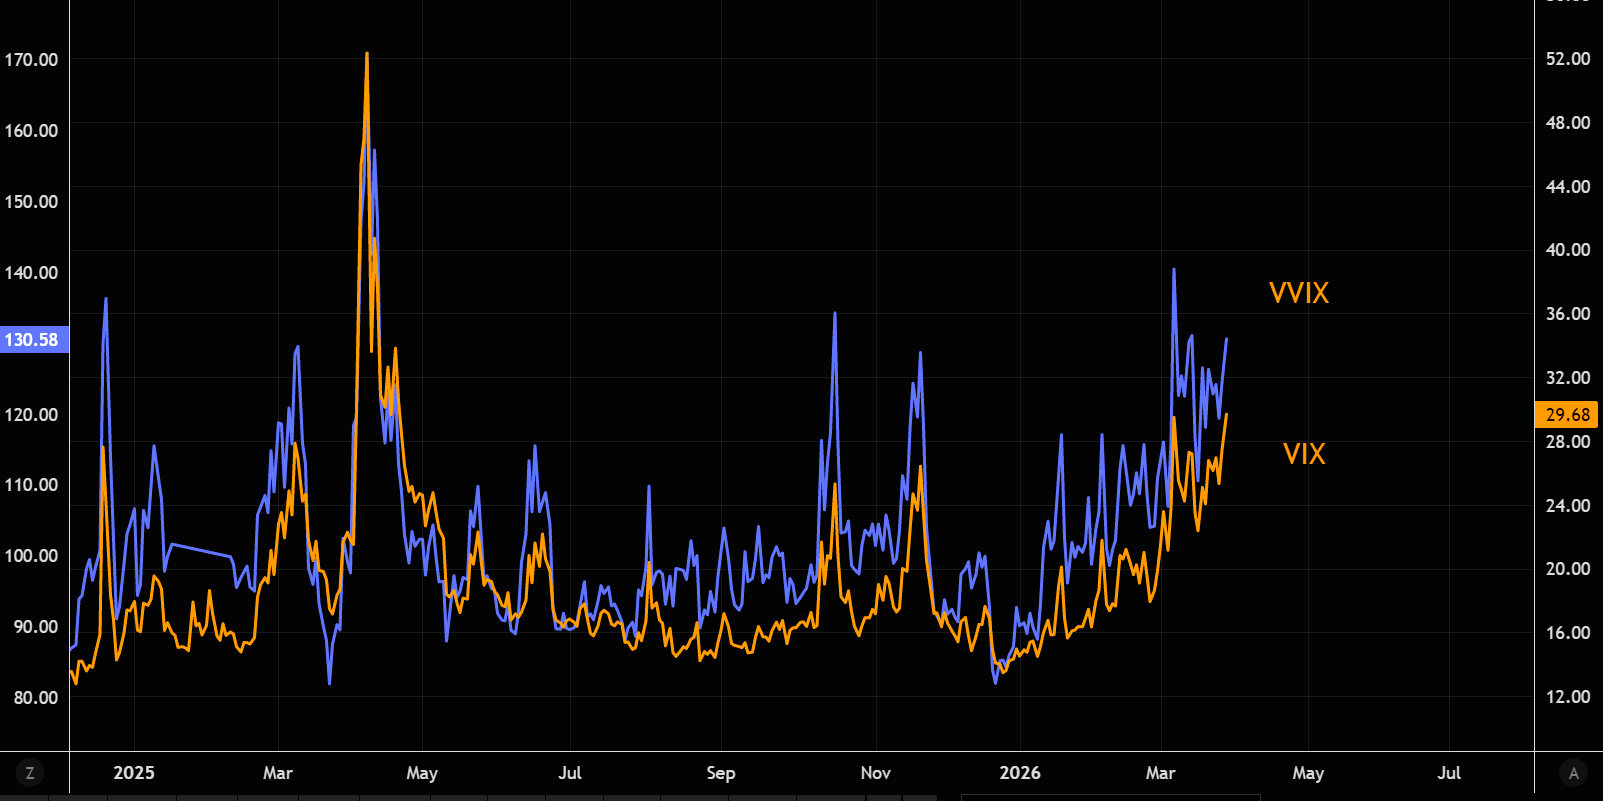
Source: LSEG Workspace
European stress
V2X is overshooting VIX, highlighting that this crisis is hitting Europe relatively harder than the US.
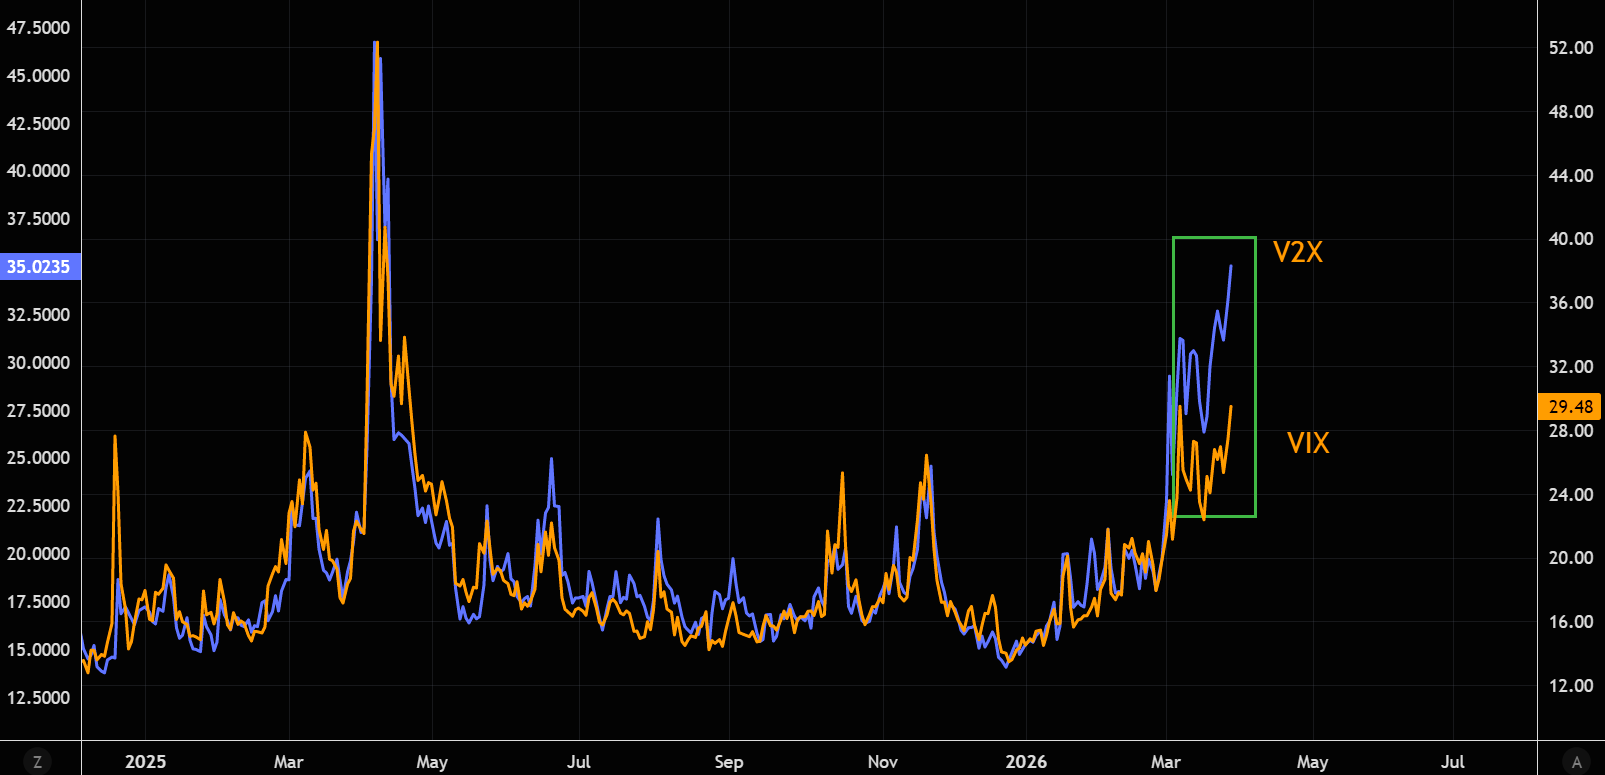
Source: LSEG Workspace
EM stress explosion
The biggest losers from the conflict are showing the most explosive moves in volatility. The chart compares EM volatility (VXEEM) with VIX.
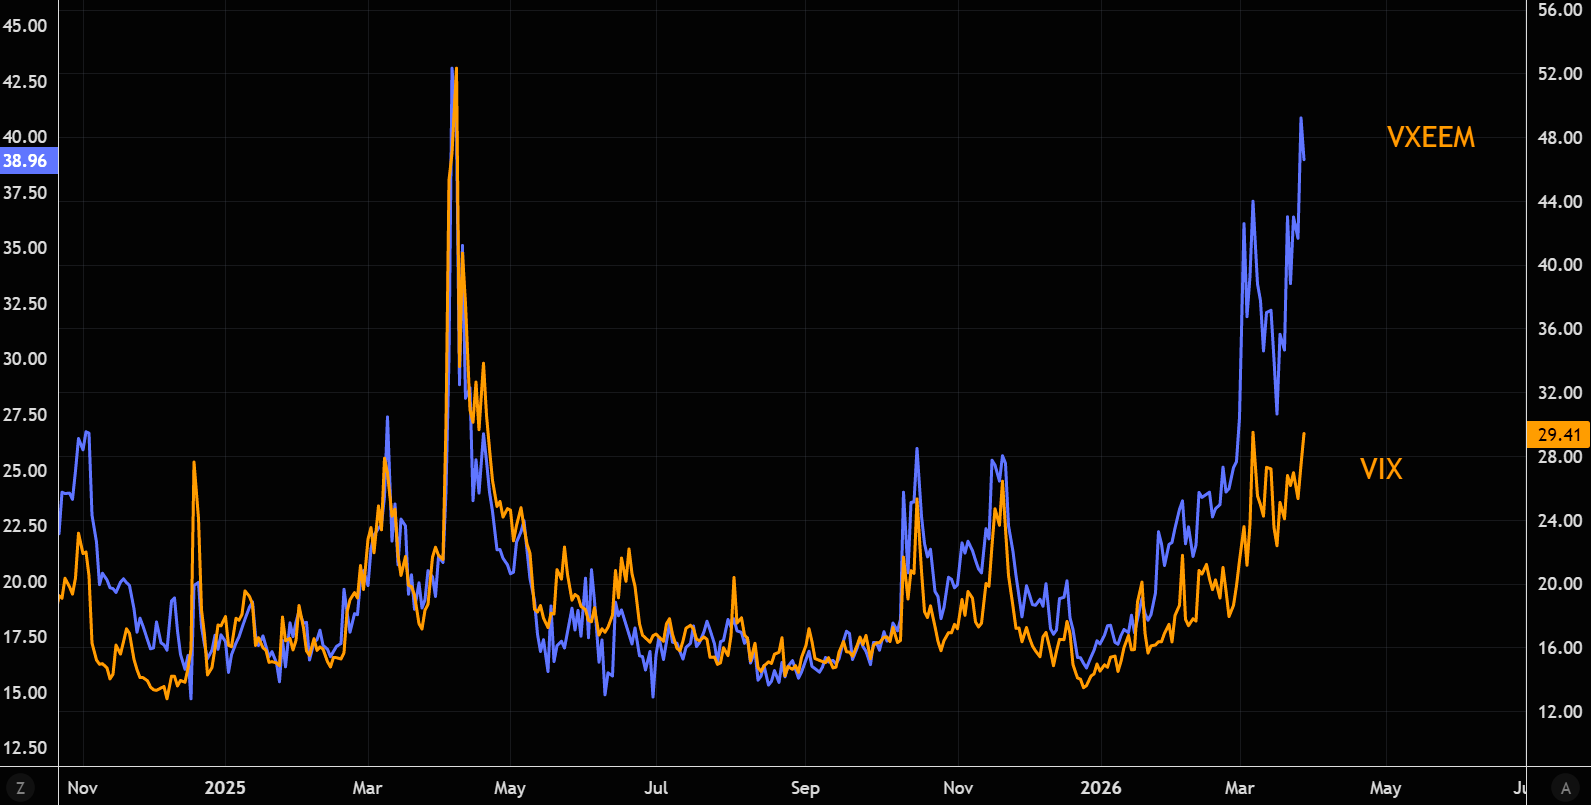
Source: LSEG Workspace
Bond vol unleashed
Believe it or not, MOVE isn’t far from the Liberation Day panic highs. Meanwhile the gap versus VIX has widened further over the past few sessions, a reminder that the real stress in markets is increasingly coming from rates.
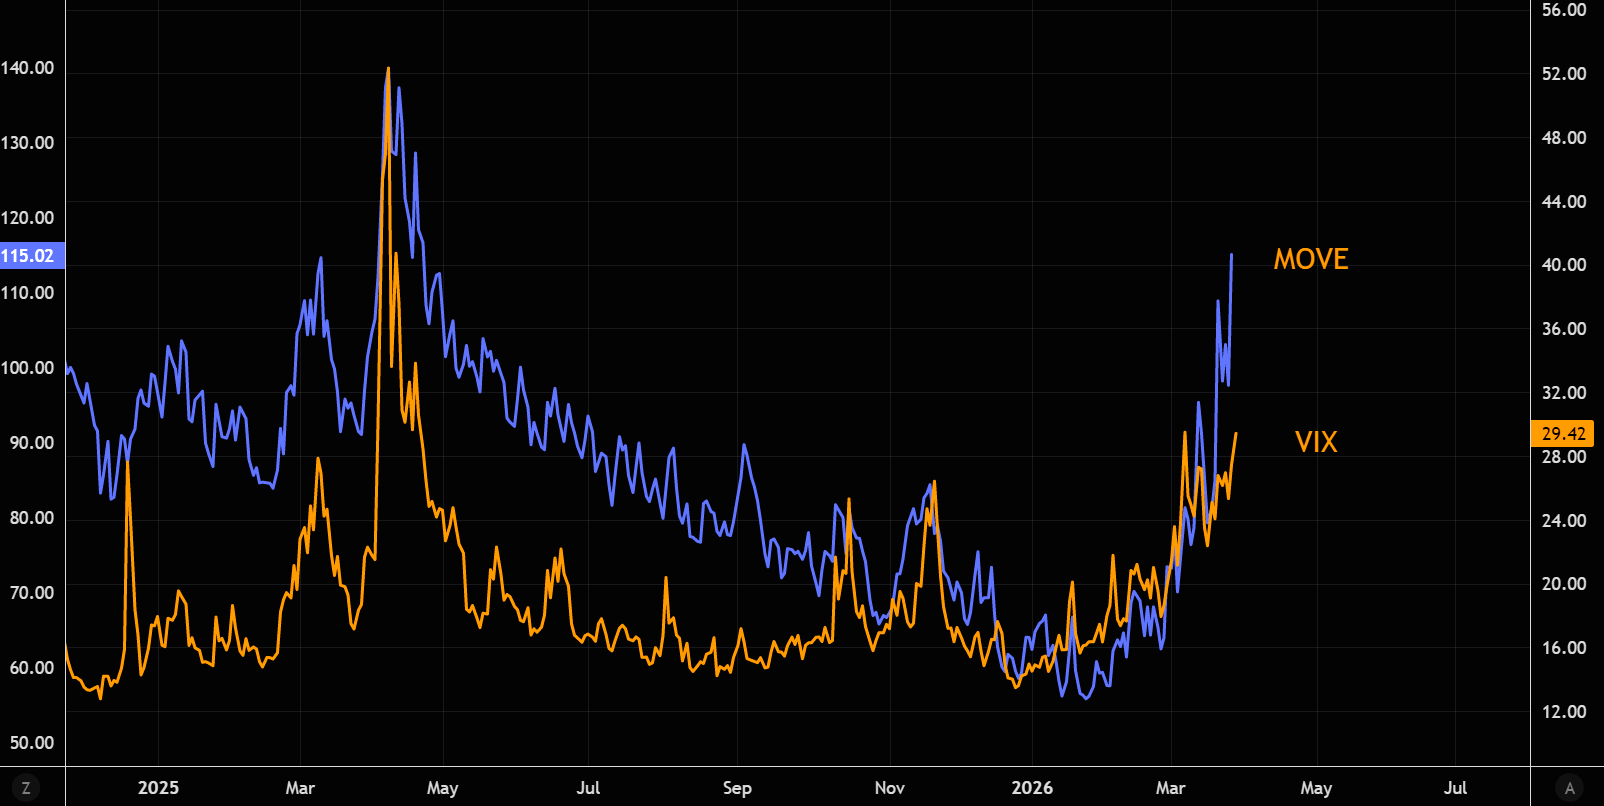
Source: LSEG Workspace
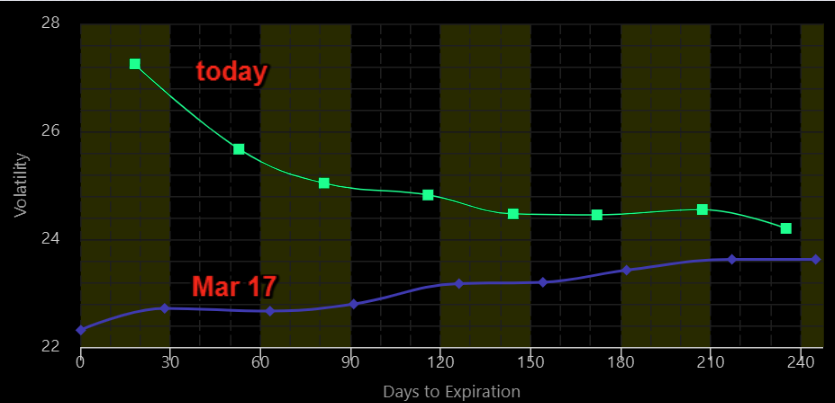
Fearful VIX structure
The VIX term structure has moved sharply higher, especially at the short end of the curve where the “quick” hedges live.
The chart compares today’s curve with last Wednesday, the lowest VIX close in recent weeks. Investors loading up on short-dated protection are clearly pricing meaningful downside risks from here.
Too much short-term fear?
Source: Vixcentral
Extreme fear
We are finally seeing some serious fear show up in sentiment indicators. Markets are not yet in full panic territory, but they are moving in that direction.
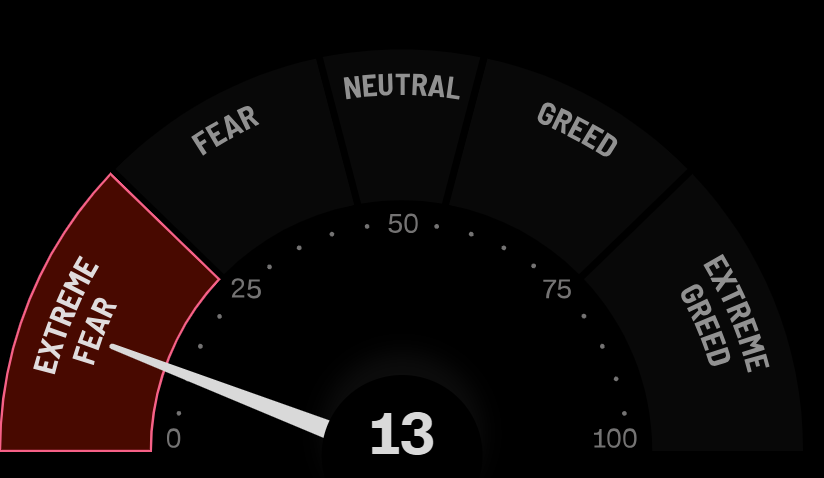
Source: CNN
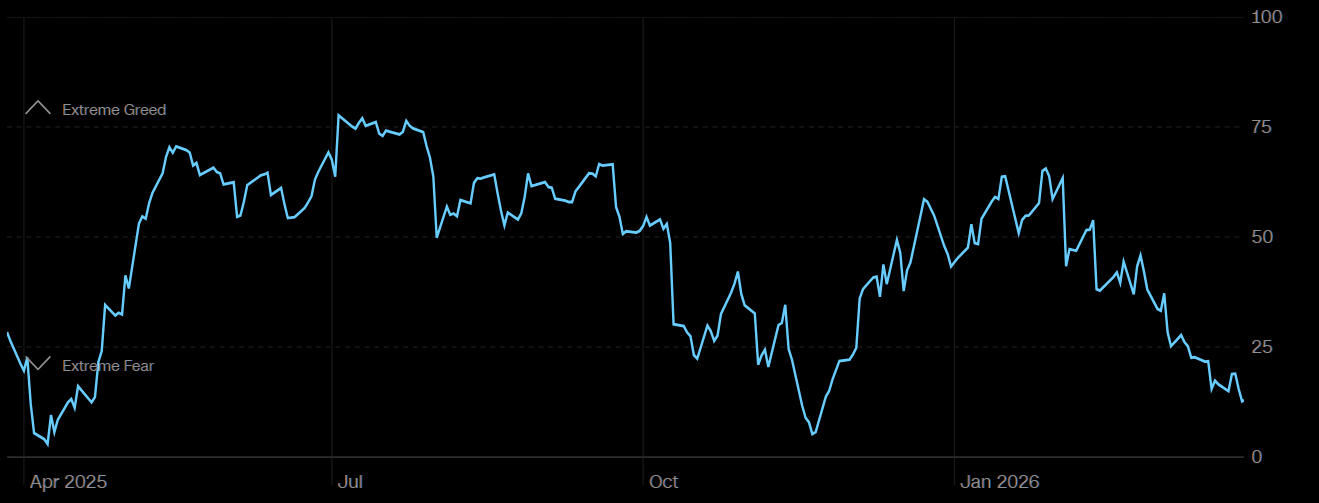
Source: CNN
Did fast money puke lows?
The long went short
Fear signals are rising across markets, but positioning has already shifted aggressively.
CTAs have sold nearly $55bn of US equities since the start of the month, leaving them net short roughly $18bn. With liquidity still poor, that selling pressure has clearly shown up in price action.
The good news, according to the Goldman flow team, is that most of this mechanical selling may already be behind us, absent a major macro shock.
Volatility drove the selling. If volatility stabilizes, even slightly, CTA behavior could quickly flip.
Source: TME/GS
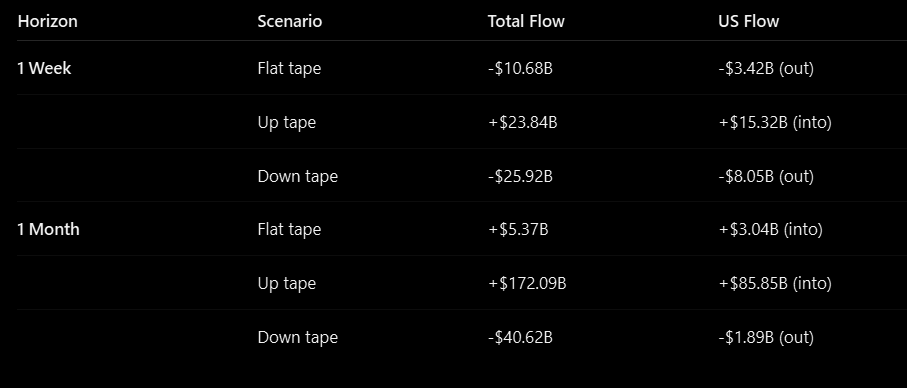
They could become big buyers
To the upside, CTAs could buy nearly $86bn of US equities over the next month if a sustained rally materializes, a move sitting in the 99th percentile over the past year.
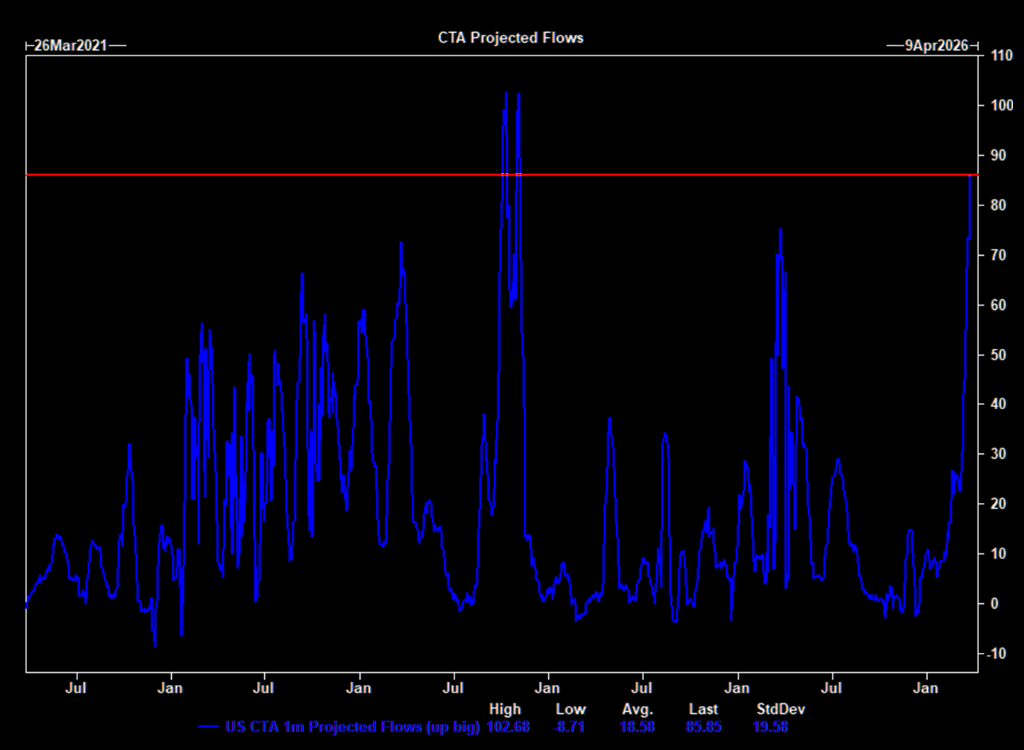
Source: GS
Massive de-gross
Institutional investors have also reduced exposure across the board. CFTC data shows Asset Managers de-grossed S&P positioning by roughly $51bn over the past three weeks, the third-largest three-week unwind in the past five years, according to Goldman.
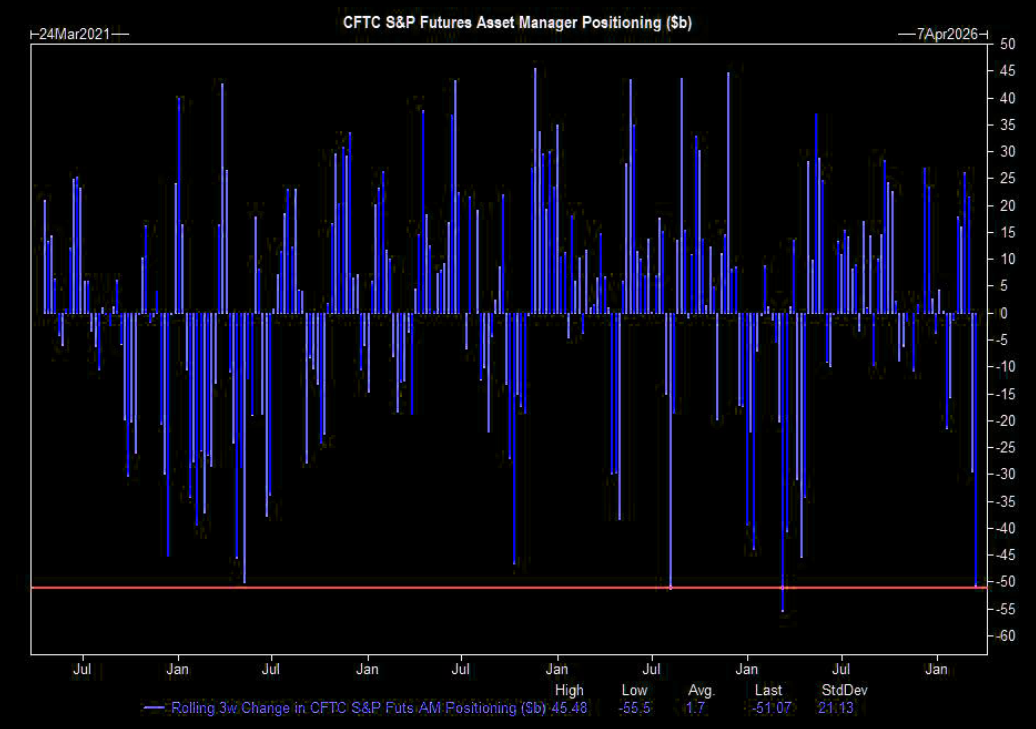
Source: GS
Works both ways
Liquidity remains poor across markets, but thin liquidity cuts both ways.
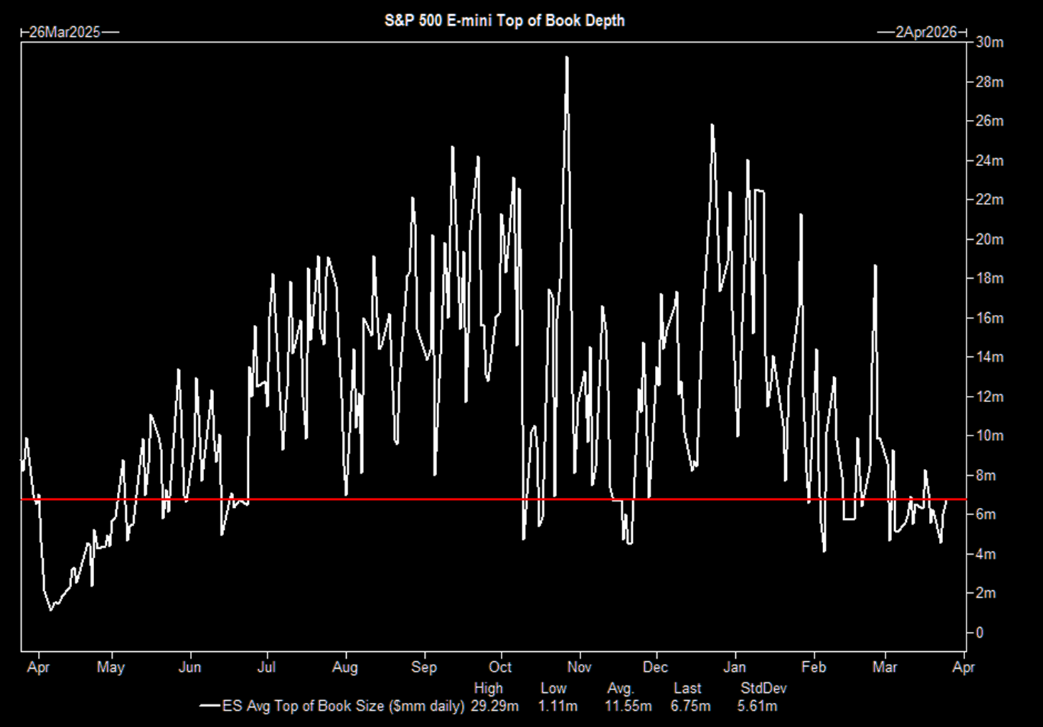
Source: GS
Fragile right tail?
Markets are clearly pricing more fear across assets.
But positioning tells another story.
Many of the fastest sellers have already dumped risk in size, meaning the same players could quickly flip into buyers if a bounce materializes.