Microsoft and Software Get ‘Epsteined,’ Leaving a Trail of Suicide Notes
SaaS drawdown deepens
First came the warnings. Then the footnotes. Then the “non-cash,” “timing-related,” “AI-transition” excuses. By the time Microsoft collapsed, software had already left a sector-wide suicide note, scattered across transcripts, slides, and adjusted metrics nobody wanted to read. Let's have a look at the carnage.
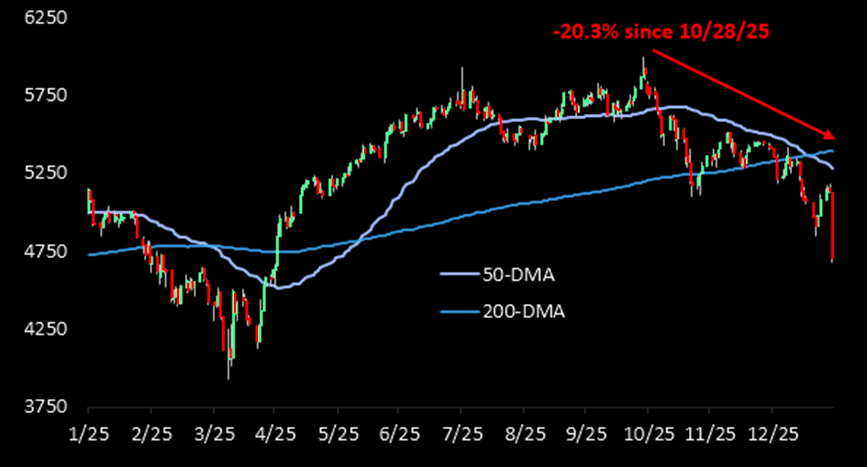
Officially a bear market
Given the steep decline yesterday, the software group is now trading at fresh local lows and has officially surpassed the 20% threshold from the October high to mark a new bear market.
Source: Bespoke
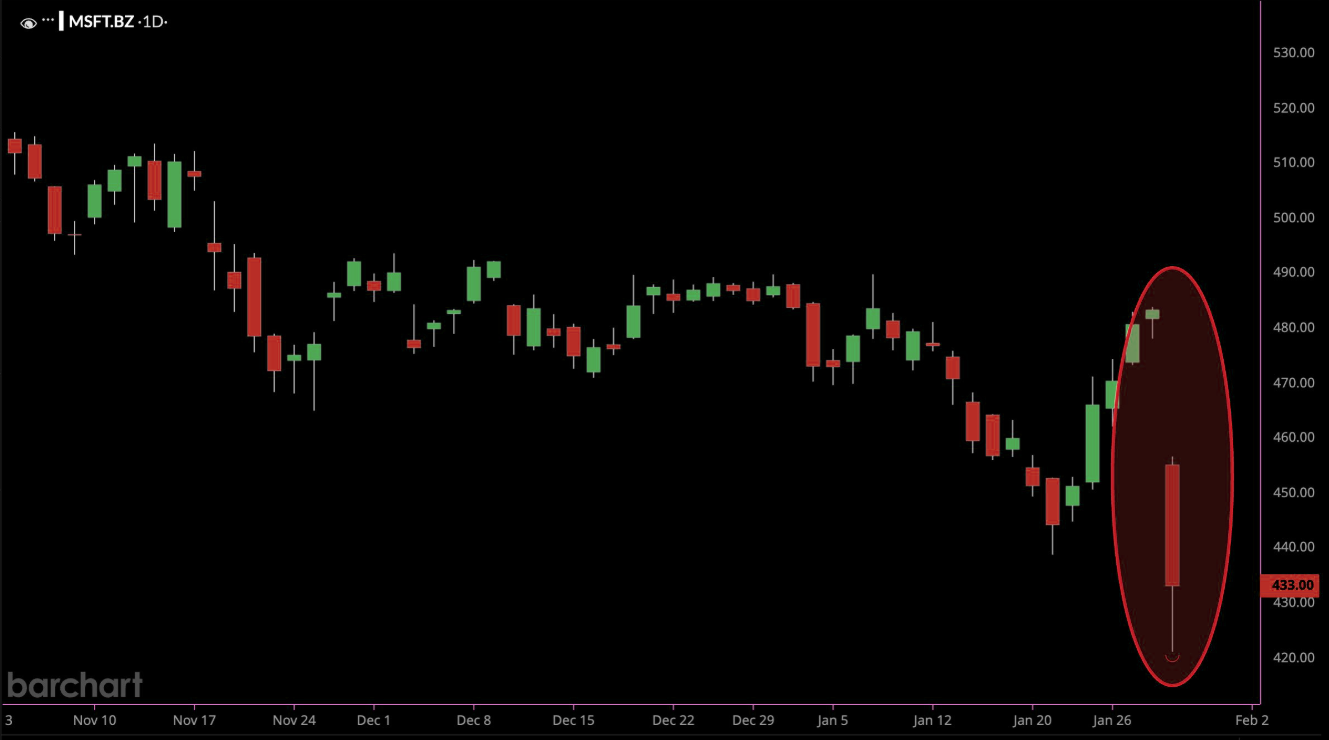
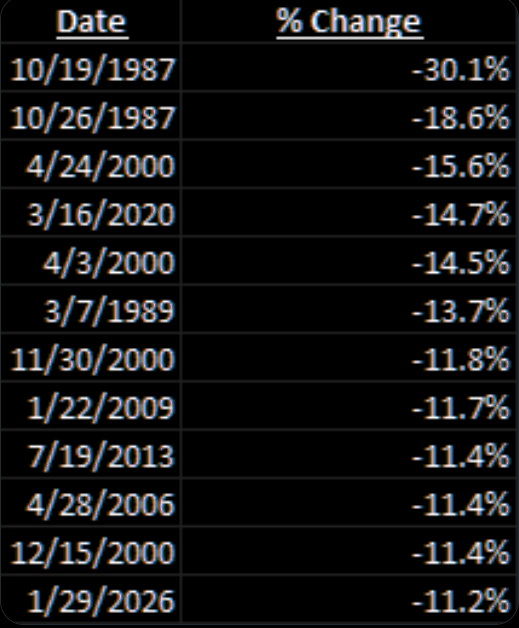
A bad day in the MS Office
Microsoft recorded its biggest loss in 6 years and its 5th worst day in the last 20 years.
Source: @barchart
Every single one
Every single software stock that has reported earnings so far this cycle has gone down.
SAP -14%
MSFT -7%
NOW -7%
MANH -3%
ROP -12%
CVLT -31%
AGYS -21%
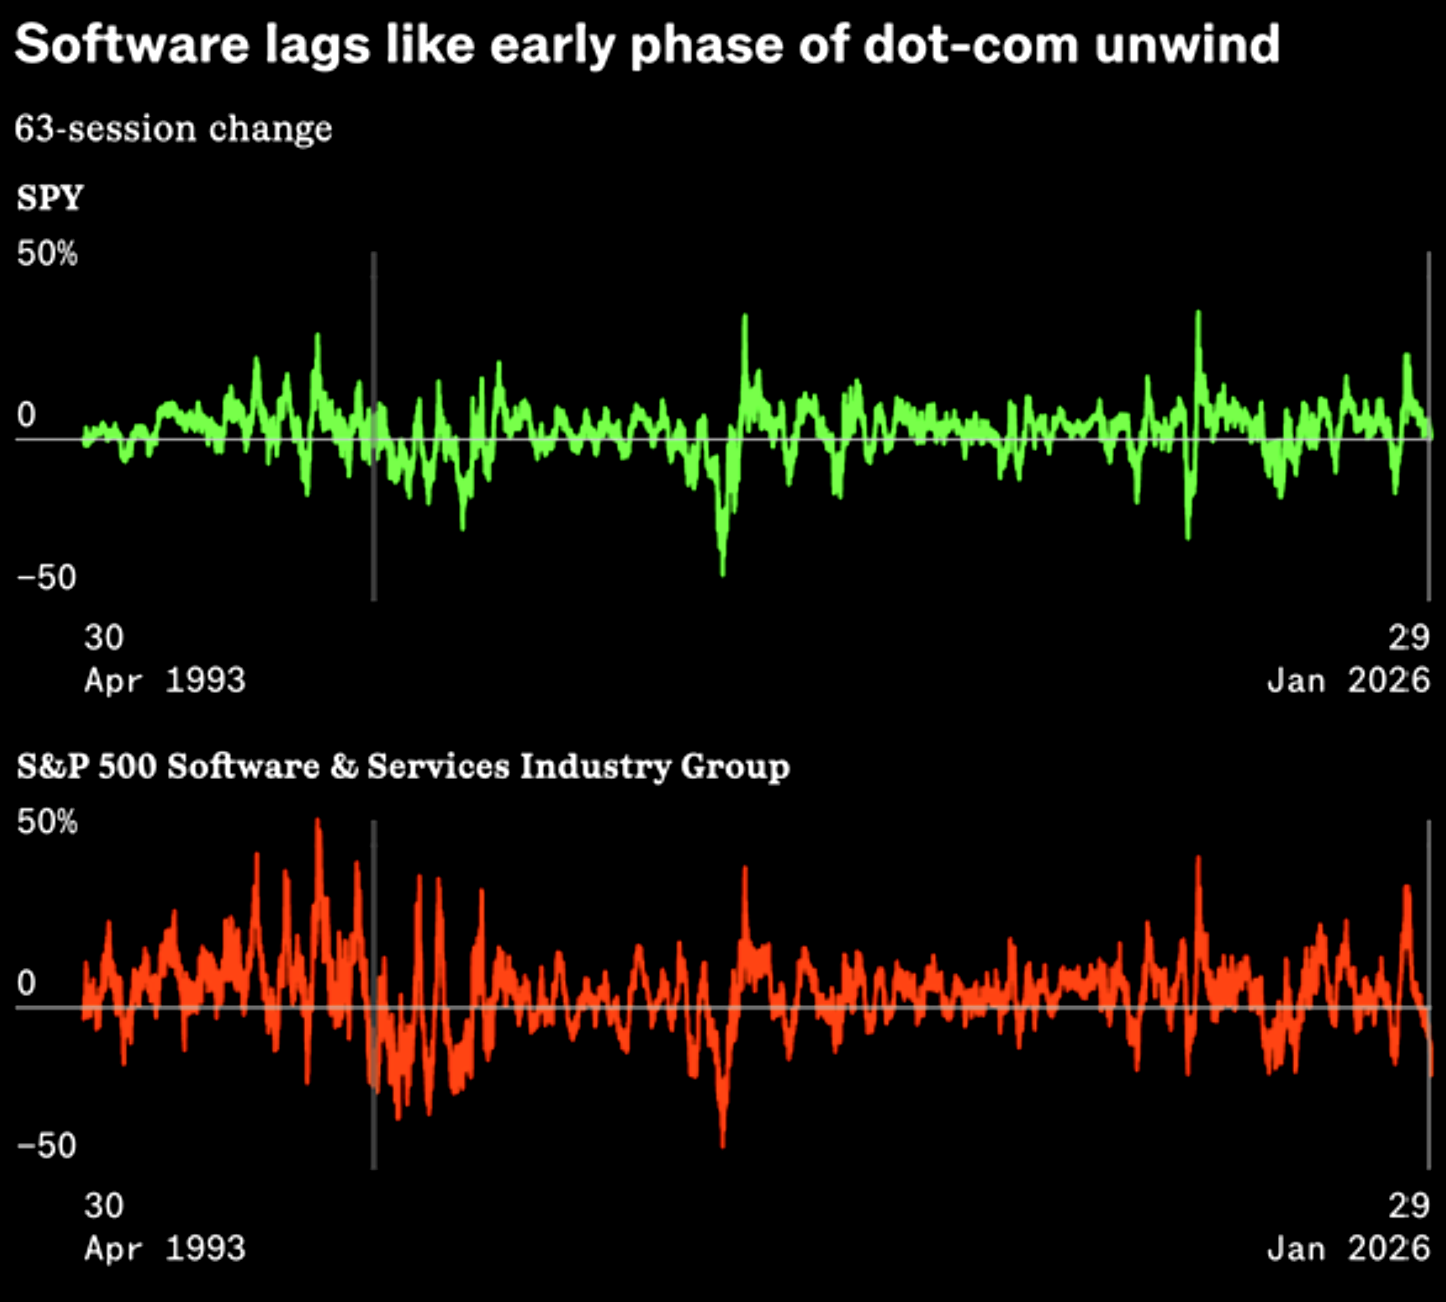
Software lags like 2000
"The last time the S&P 500 Software & Services industry group was down at least 20% over a 63-session stretch while [SPY] was positive happened to be June 12, 2000."
Source: Sherwood
Sell-offs we remember
Worst selloffs in Microsoft history:
- Crash of 87
- Tech crash
- GFC
- Covid
- Azure misses buyside bogey
Source: Modest Proposal
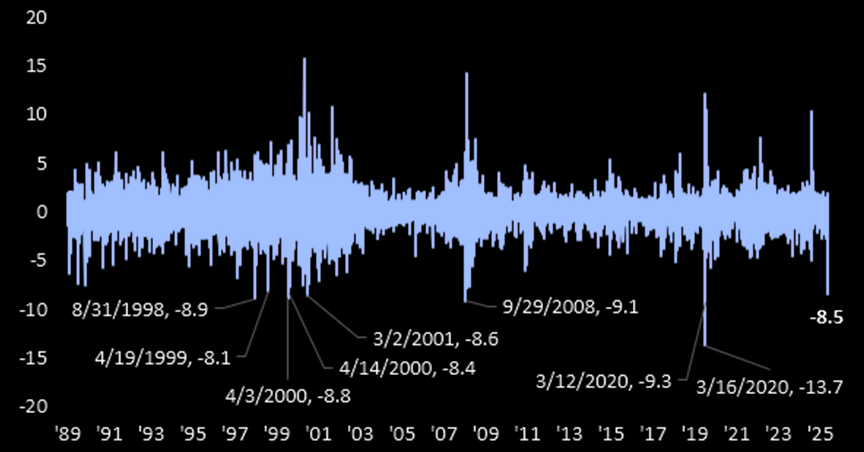
How extreme?
Yesterday was the single worst decline since the midst of the COVID crash when it fell 9.3% on March 12th and 13.7% on March 16th, 2020.
Source: Bespoke
Vs market
The Software & Services industry is underperforming the broader S&P 500 by almost 8 percentage points. There have only been five other days on record with that degree of underperformance. The most recent of those: March 2001.
Source: Bespoke
The ChatGPT curse
"The two mega-caps with the largest revenue exposure to OpenAI (potentially IPOing this summer), Microsoft MSFT and Oracle ORCL, have seen their combined market cap fall by $1.1 trillion since the 10/28 peak."

Source: Bespoke
Are we there yet...?
Current software EV/FCF multiples...
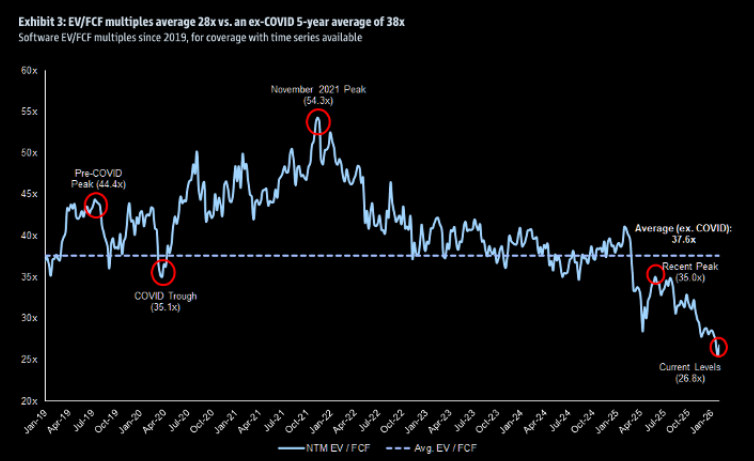
Source: Goldman
The longer term valuation picture
Here's a longer timeline chart with EV/FTM Revs (chart via JPMorgan).
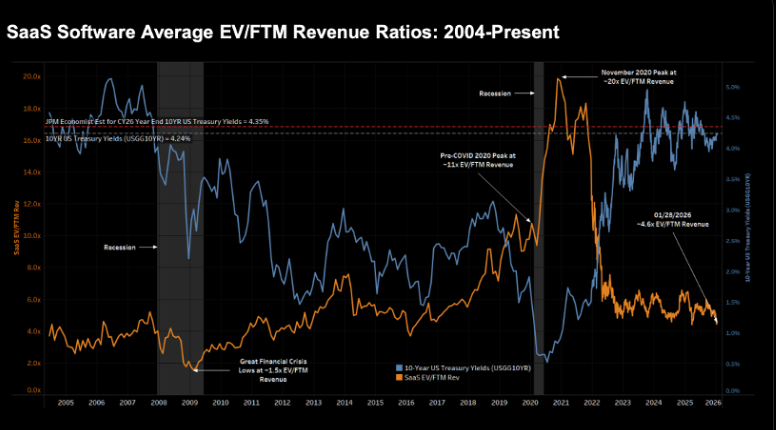
Source: JPM
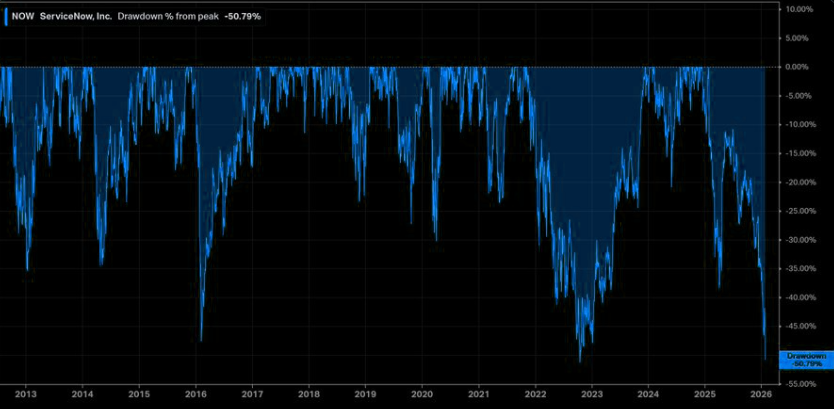
Drawdowns
Here is a list of 5 SaaS names nearing the largest drawdown in their history. The chart shows NOW -51% - drawdown largest in history.
$CRM -41% drawdown.
$HUBS -67% drawdown nearing largest in history.
$TEAM -74% drawdown, largest in history.
$PAYC -75% drawdown largest in history.
Source: Q-Cap
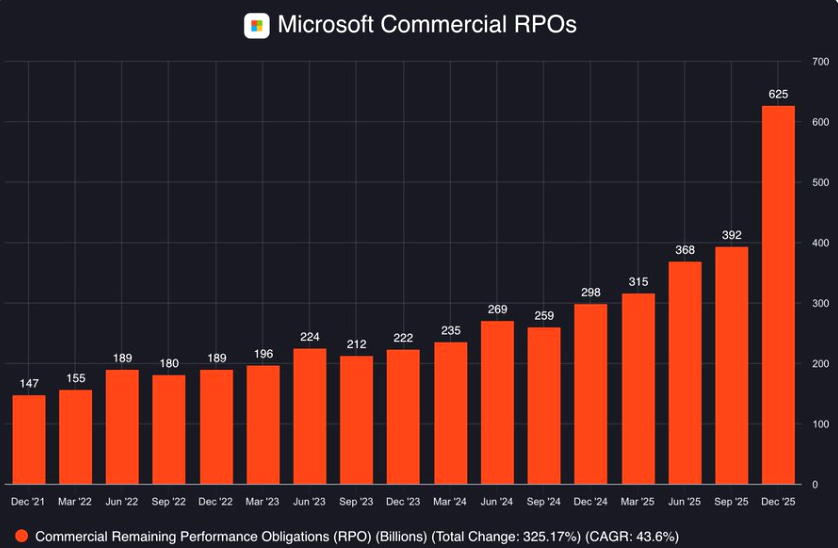
You know your RPO
MSFT: "Commercial remaining performance obligations...increased to $625B, up 110% Y/Y, with a weighted average duration of ~2.5 years."
Chamath: "If you look across the software industry, you see record levels of RPO - these are future revenues that are tied to a performance obligation before you can recognize it and before a customer has to pay you. The problem with RPO is that AI can more easily attack and devour it. The safest assumption would be to value a software company by valuing their RPO at 0."
Source: The Transcript
The credit view: Going to be a lot of zeros
"Private credit guys are massively overweight legacy software / SaaS on an outright basis and vs. the HY index $HYG. The move in legacy SaaS names $ORCL $MSFT $CRM $NOW $HUBS continues to work against them. Going to be a lot of zeros. The 2nd derivative exposure are going to interesting to watch. Especially in the BDC, and CLO space."
Source: Lake Cornelia Research Management
Positioning
"We've highlighted significant YTD supply & length reduction across the Software space (Software L/S ratio & Software % of our PB book each at record lows). Light positioning, in theory, SHOULD be a tailwind for the space, however price action suggests the market is willing to continue to push thematic tilts (long AI infrastructure vs. short enterprise SAAS, among other popular tilts) despite technically "stretched" levels."
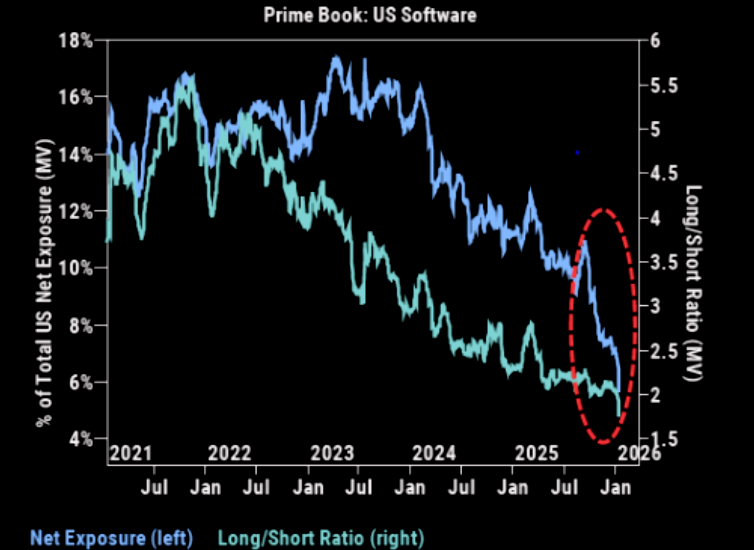
Source: GS Prime
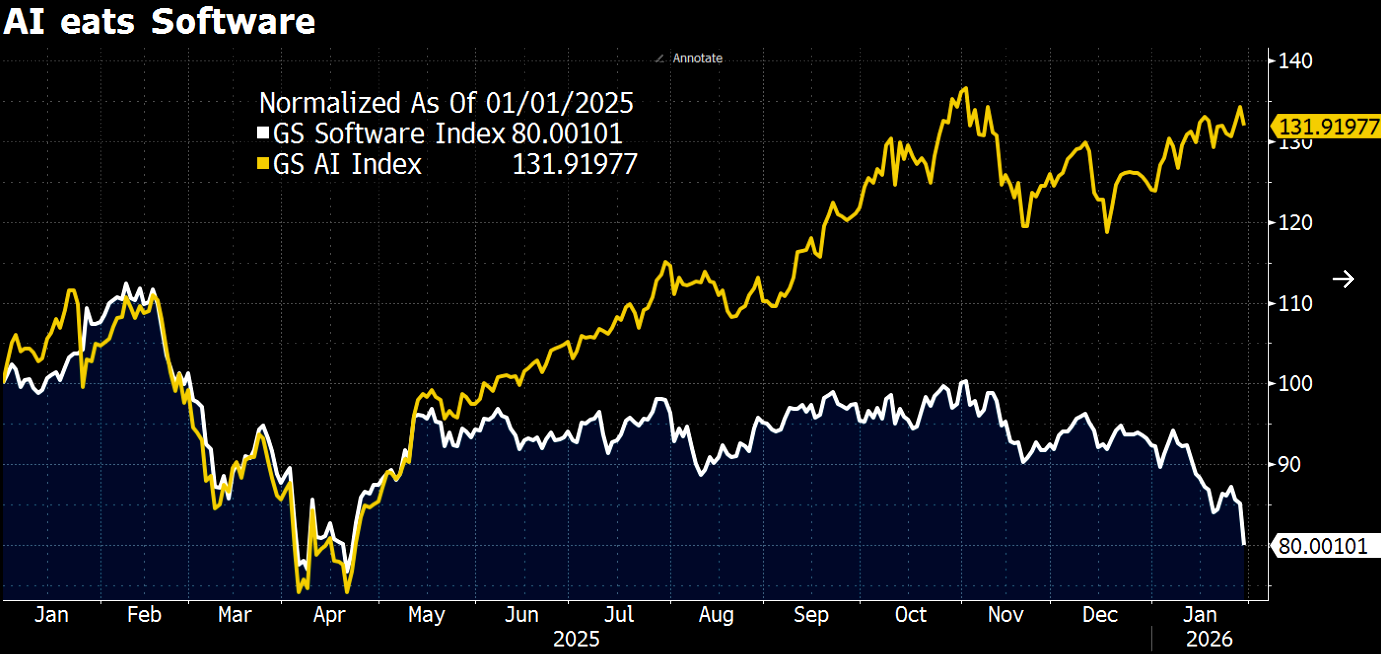
Alligator eating
You cannot spell neither alligator nor eating without A & I.