Monday Mayhem Setup: MoMo Crash, CTA Sell Signals And Retail Still “Buying The Dip”
Can "never" happen?
The setup for Monday looks ugly. MoMo pairs just had their worst week since 2022, skew is at the 99th percentile, CTAs are flipping short and hedge funds are de-grossing tech. With oil trading like a meme coin this is a fast market on steroids and this week will be volatile to say the least. Here are 14 charts on the positioning backdrop you need to know as we enter the week where perhaps "never" might just happen.
The MoMo sell-off
GS TMT Momentum Pair (leaders vs. laggards) closed down ~16% on the week, it’s worst week since November of 2022. The pair has gone from being technically ‘over bought’ at the end of February, to now, nearly in ‘oversold’ conditions).
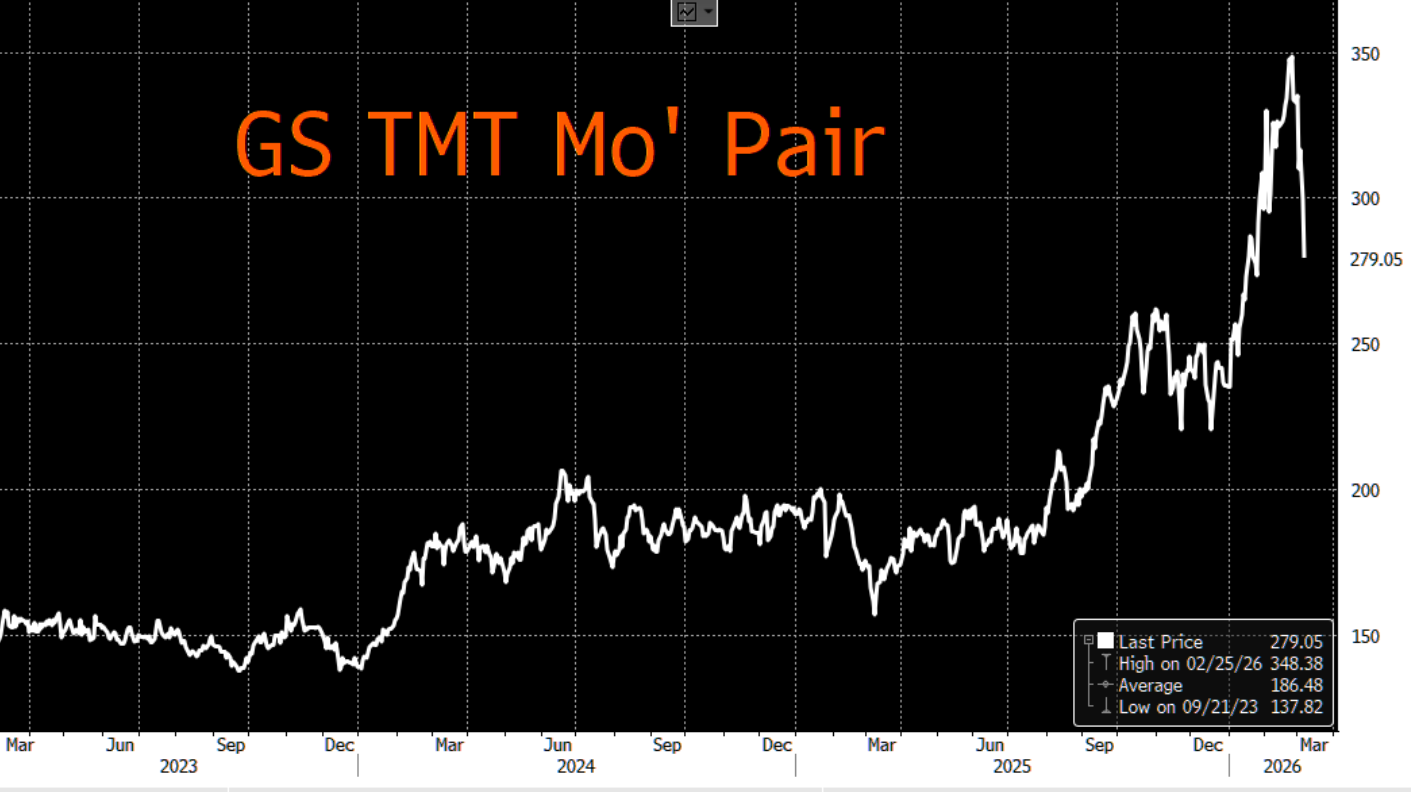
Source: GS trading desk
Oversold = overbought
Oversold stocks now outnumber overbought stocks after a long stretch of the opposite.
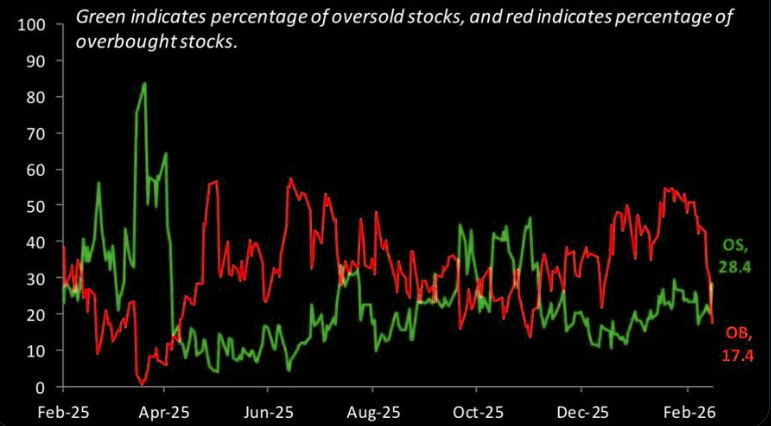
Source: Bespoke
Slightly below neutral
DB: "Equity positioning has dipped slightly below neutral."
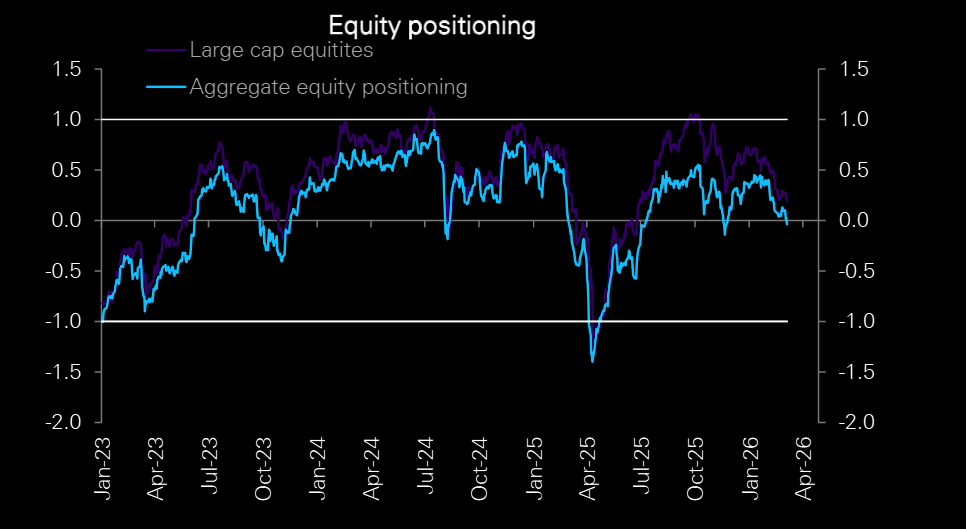
Source: Deutsche Bank
Retail Army not backing down
February was the 5th-strongest month on record for individual investor equity purchases. Retail investors have now purchased stocks for 26 consecutive months. Furthermore, average daily retail options volumes in 2026 are now +14% above 2025 levels. This is also up +47% compared to the 2020-2025 average.
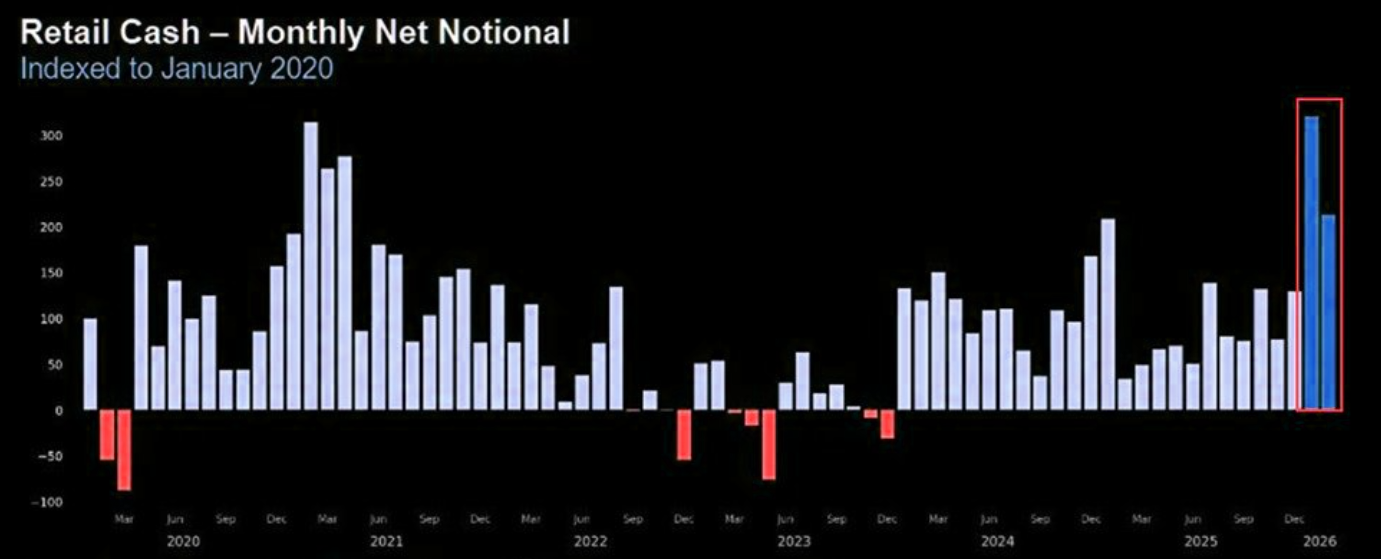
Source: Citadel
Skew
1-month skew entering Friday was at the 99th percentile on 10 year lookback.
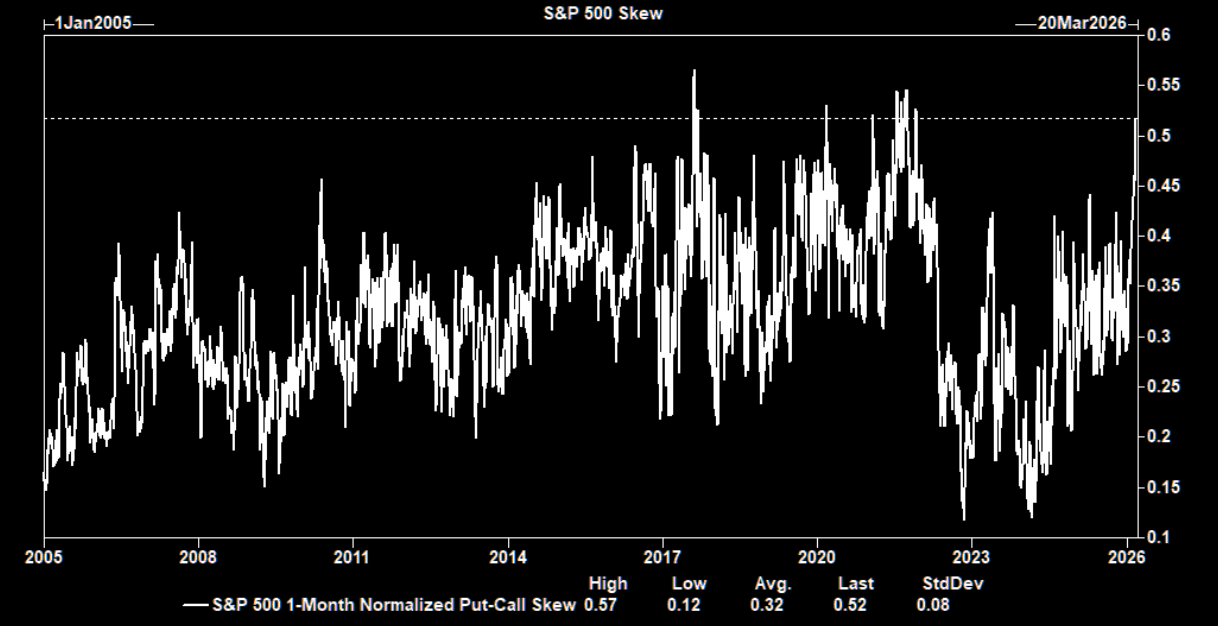
Source: GS
Correlation
One-week realized correlation remains extremely low… right around the 10th %tile on a five year lookback.
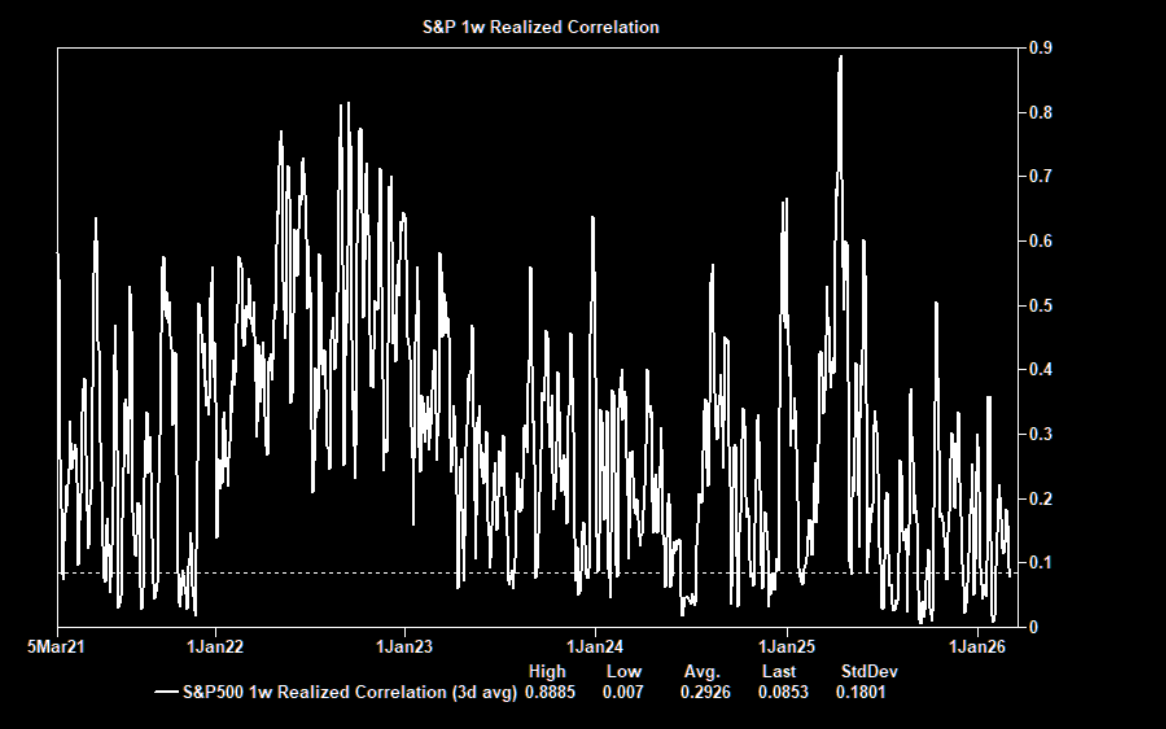
Source: GS vol desk
One of the few bullish things out there
Brian Garrett: "The vol panic/vol stress indicator closed the week at 9.7... the fact that the vol market is so distraught might actually be one of the few bullish things out there."
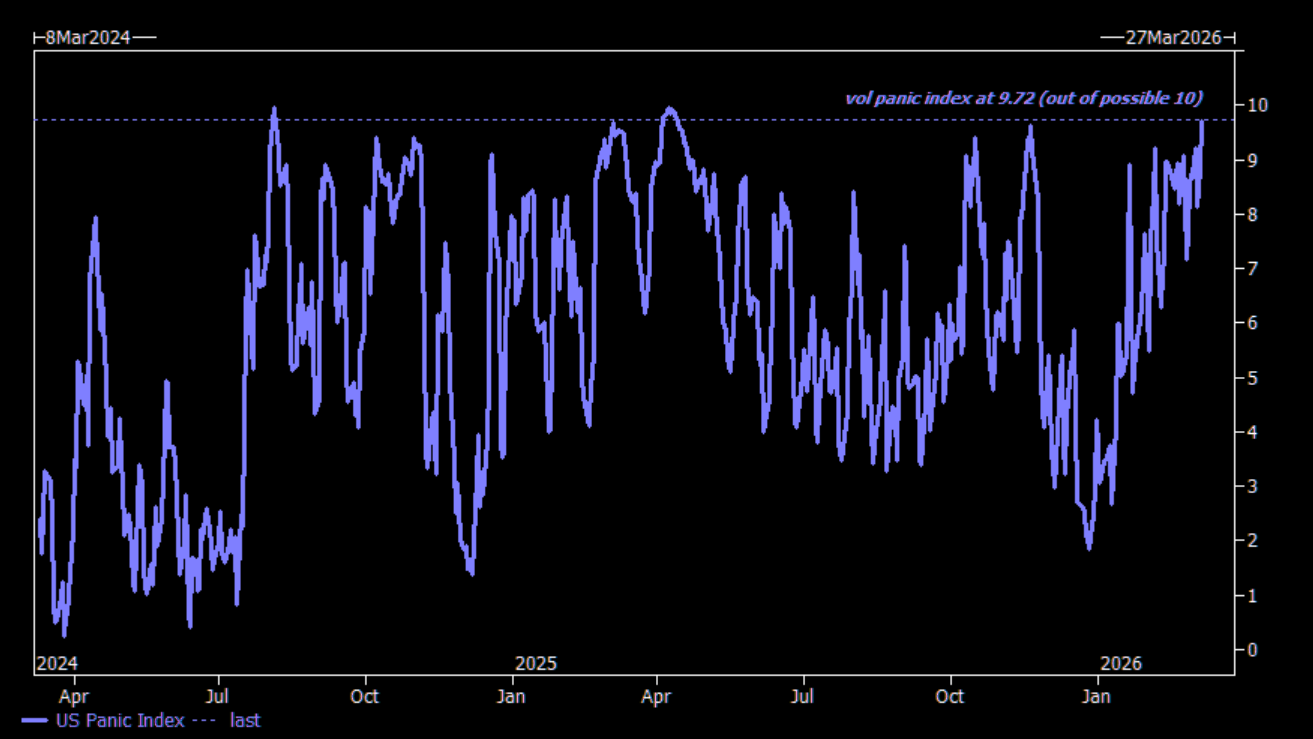
Source: Brian Garrett, GS
Some selling
The overall delta-one flow observed from the GS trading desk last week:
1. US equities were net sold for a 3rd straight week.
2. US-listed ETF shorts rose +8.3%, the 2nd largest increase in the past 5 years, which points to elevated hedging activity.
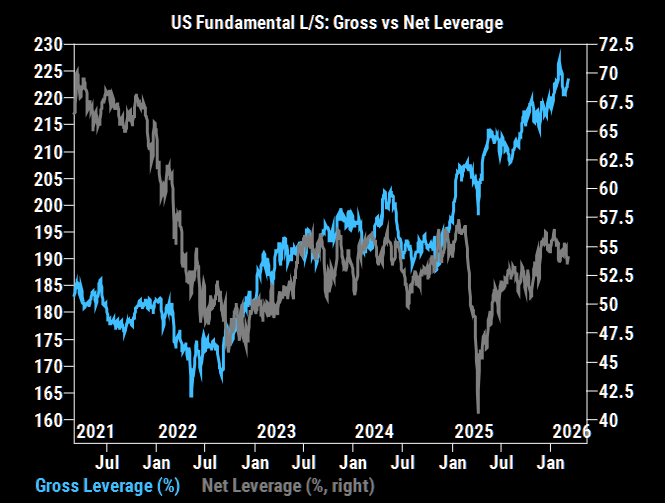
3. US L/S Gross leverage increased +2.1 pts to 224.5% (97th percentile one-year), while US L/S Net leverage rose +0.5 pts to 54.8% (82nd percentile one-year).
Source: GS Prime
Tech de-gross
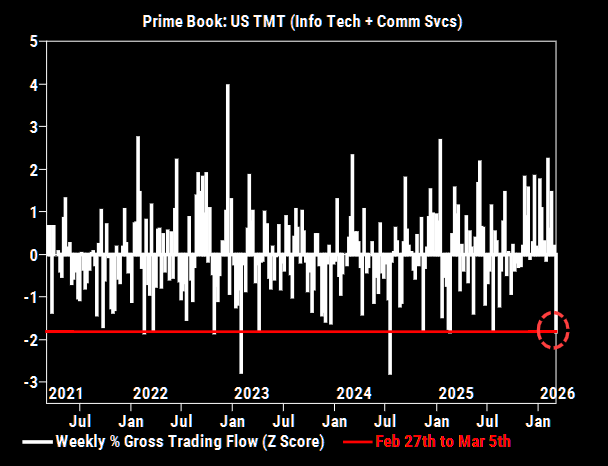
In % terms, this week’s de-grossing activity in US TMT (Info Tech + Comm Svcs) was the largest since Jul ’24 and one of the largest in the past 5 years (-1.8 z score).
Source: GS Prime
Alligator gap did not close much
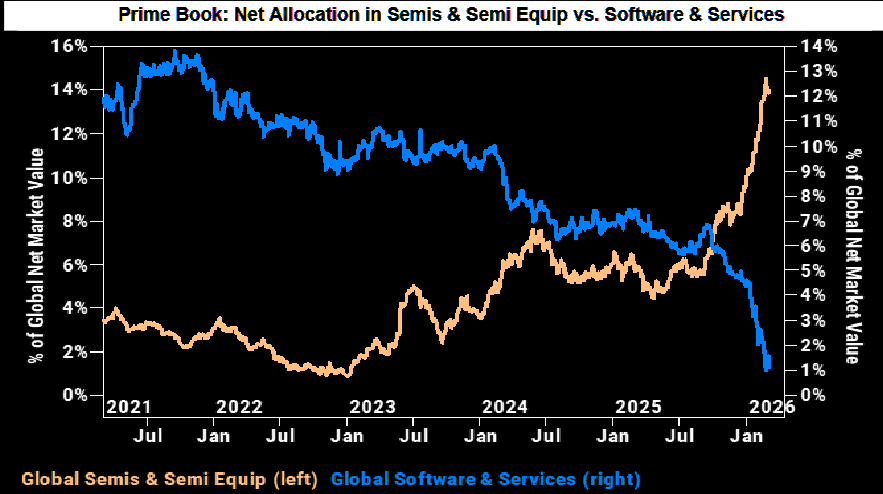
Despite a proper bounce in software this week, we cannot see much closure of the positioning gap between software & semis.
Source: GS Prime
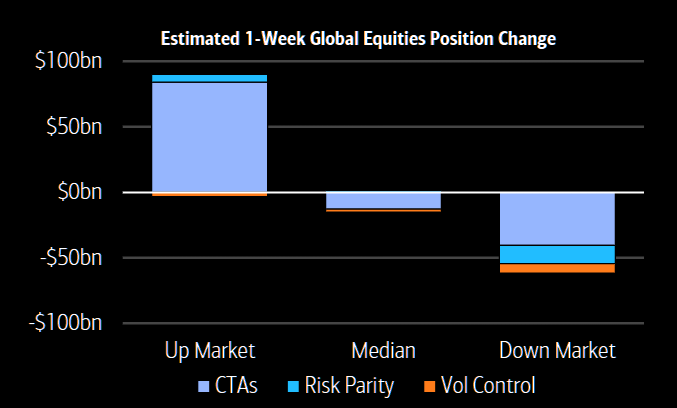
Systematic now symmetric
Risk is now two-sided with systematic flows buying on the upside or continuing to sell on the downside. Systematic strategies could sell $62bn in a down market, sell $14bn if markets are flat, and buy $87bn in an up market.
Source: BofA Quant
63rd percentile
Systematic strategies positioning down to 63rd percentile, a 2026 low.
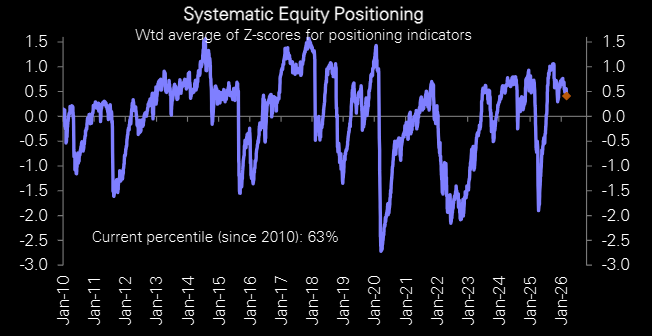
Source: Deutsche Bank
CTAs: This will look worse Monday morning...
Brian Garrett: "waiting for the CTA data to flip negative has been like watching an accident occur in slow motion … the “short term trading signals are now in negative territory for most global equity markets … our models forecast $35bn of global equity selling as of Thursday close” … this will look worse Monday morning."
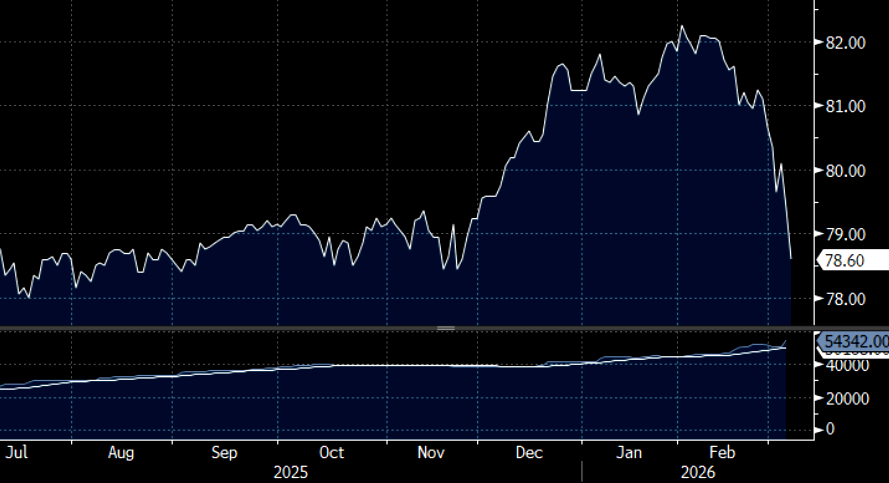
A round-trip in dividends
2028 SPX Dividend Futures (should be a pretty "fundamental" indicator) have erased the spike since beginning of December.