Oil Breakout Meets Extreme Geopolitical Risk
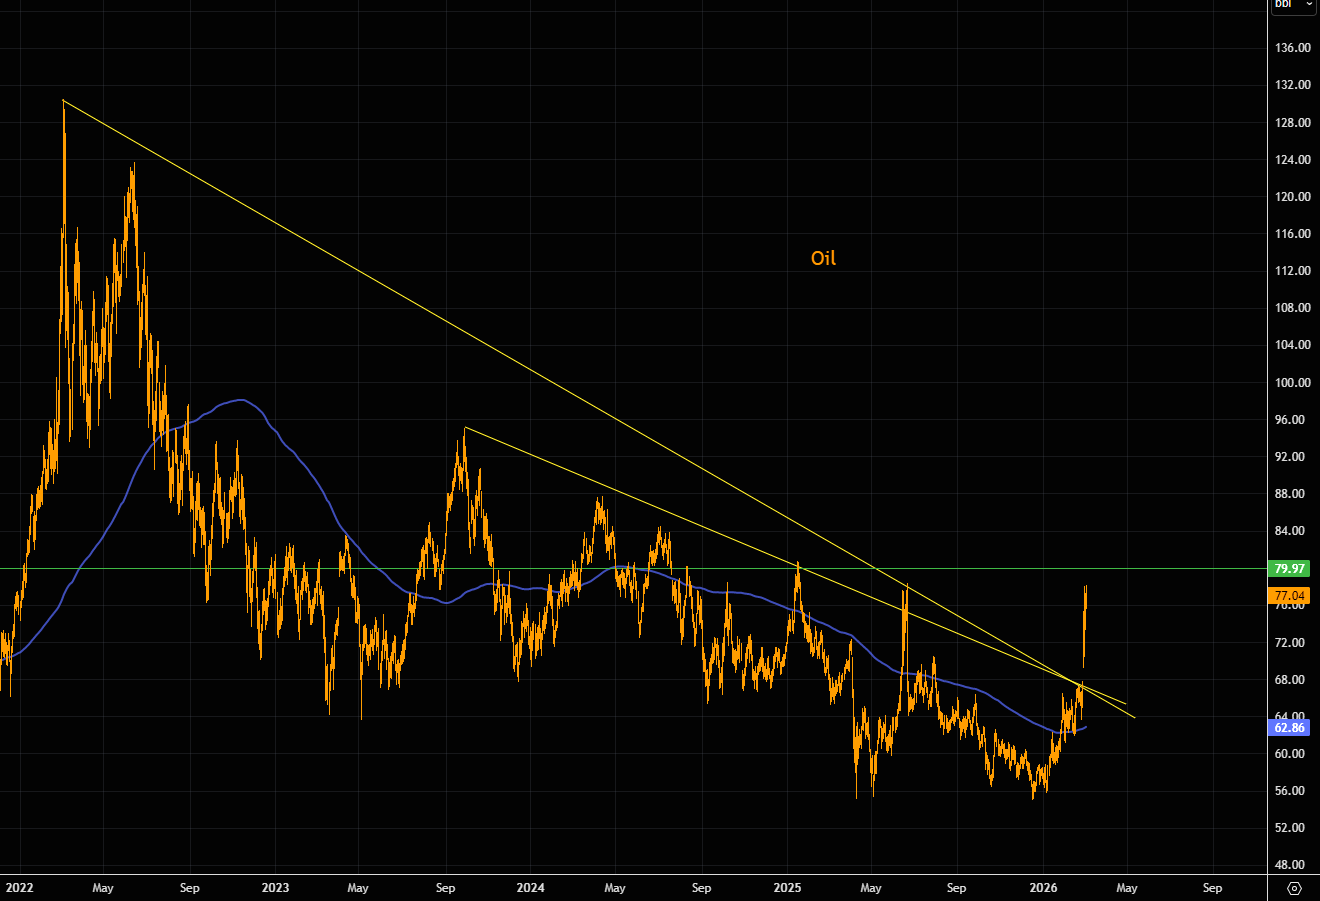
The breakout
Oil’s latest surge has taken out the negative trend lines that had been in place for years. The big resistance to watch now is $80. Note that we haven’t traded this far above the 200-day moving average in a long time.
Source: LSEG Workspace
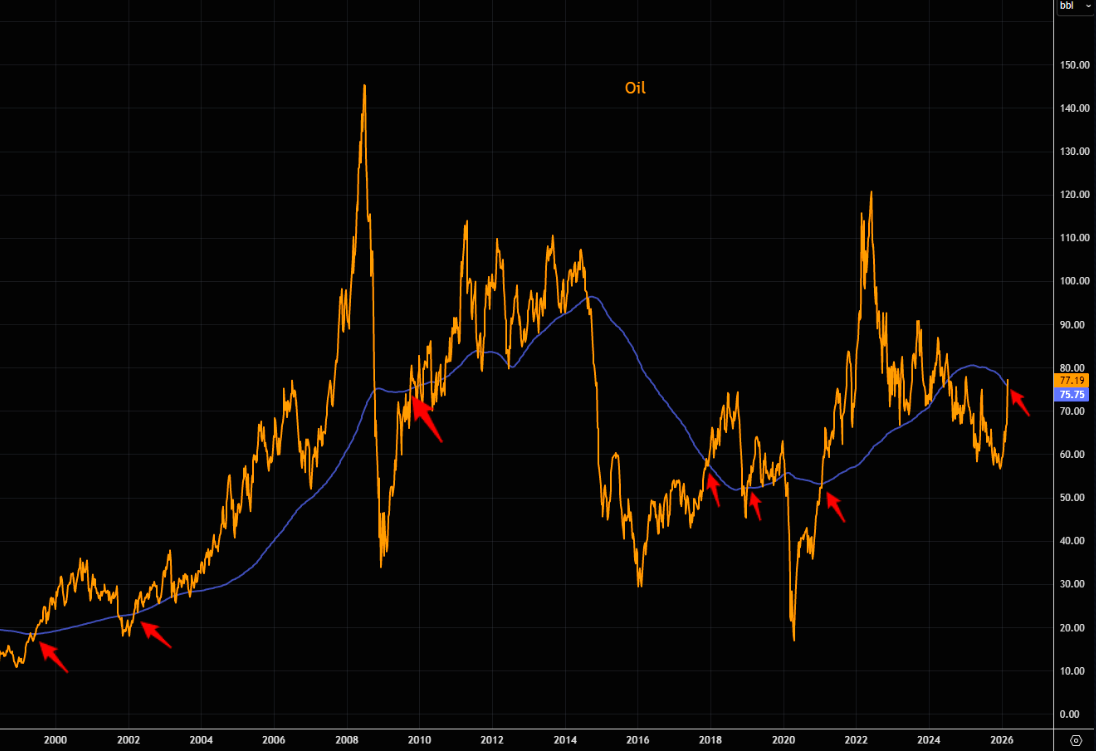
200-week
Oil is breaking above the 200-week moving average for the first time in years. Historically, moves above this long-term average have tended to lead to further upside in oil, at least in the near term.
Source: LSEG Workspace
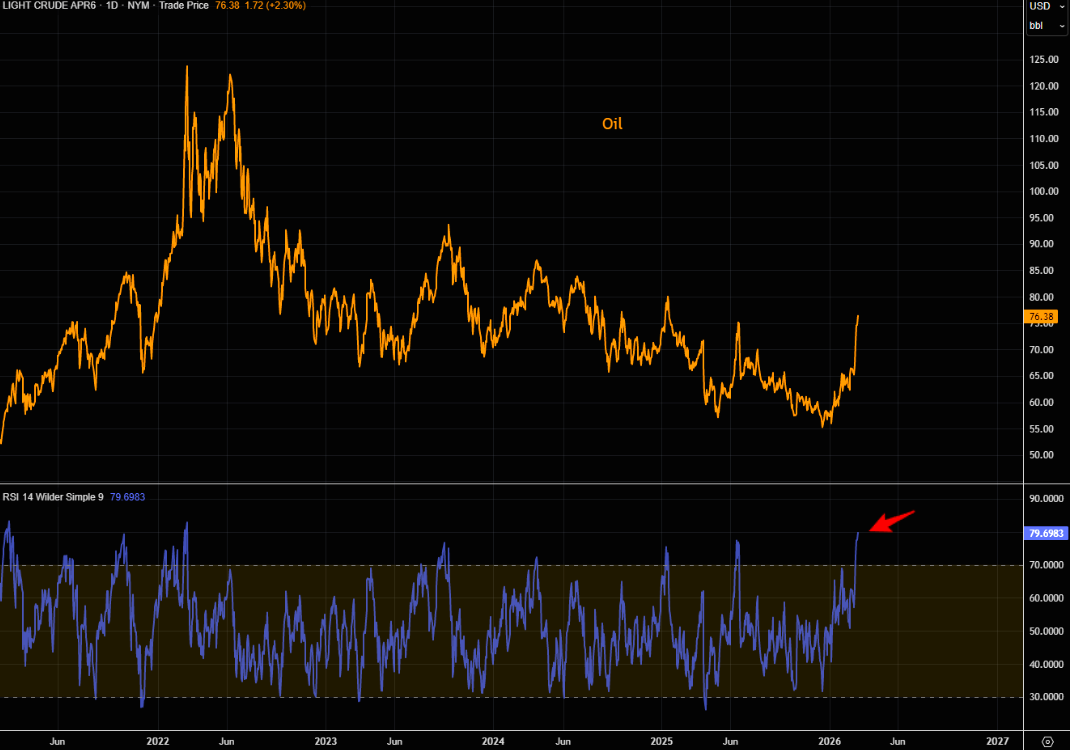
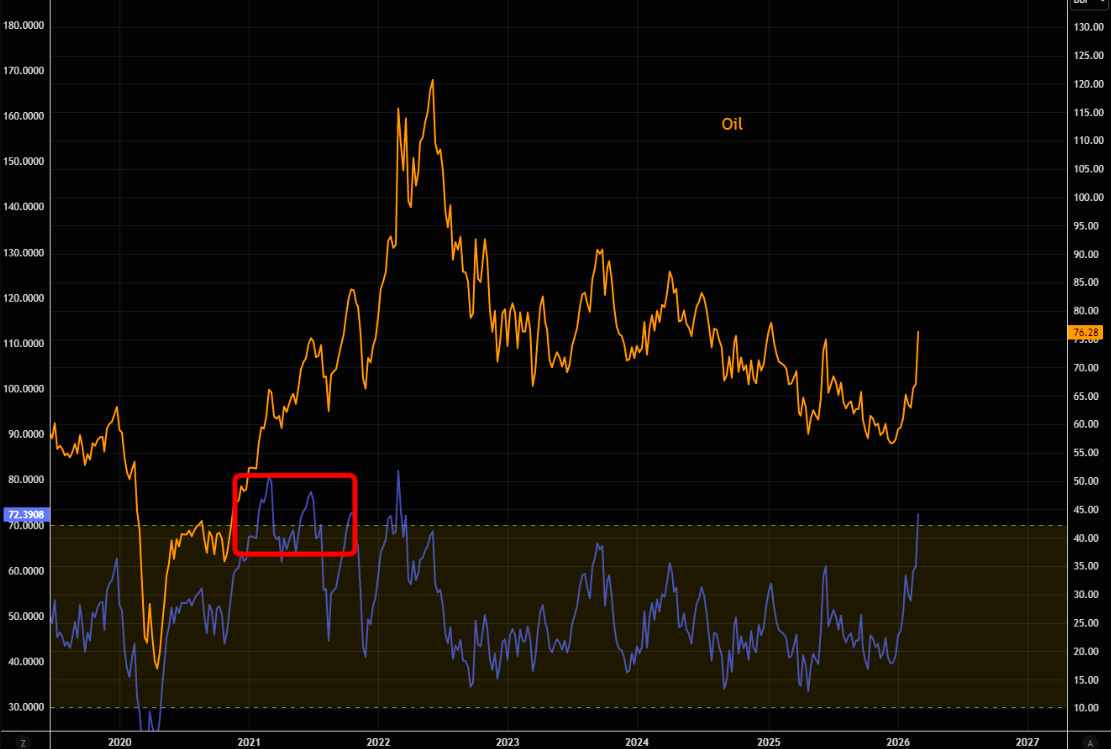
Overbought
Oil hasn’t been this overbought since 2022. The second chart shows the weekly perspective, with the weekly RSI also at the highest levels in years. The main issue is that elevated RSI levels can remain overbought for longer than most expect, as seen during several months in 2021.
Source: LSEG Workspace
Source: LSEG Workspace
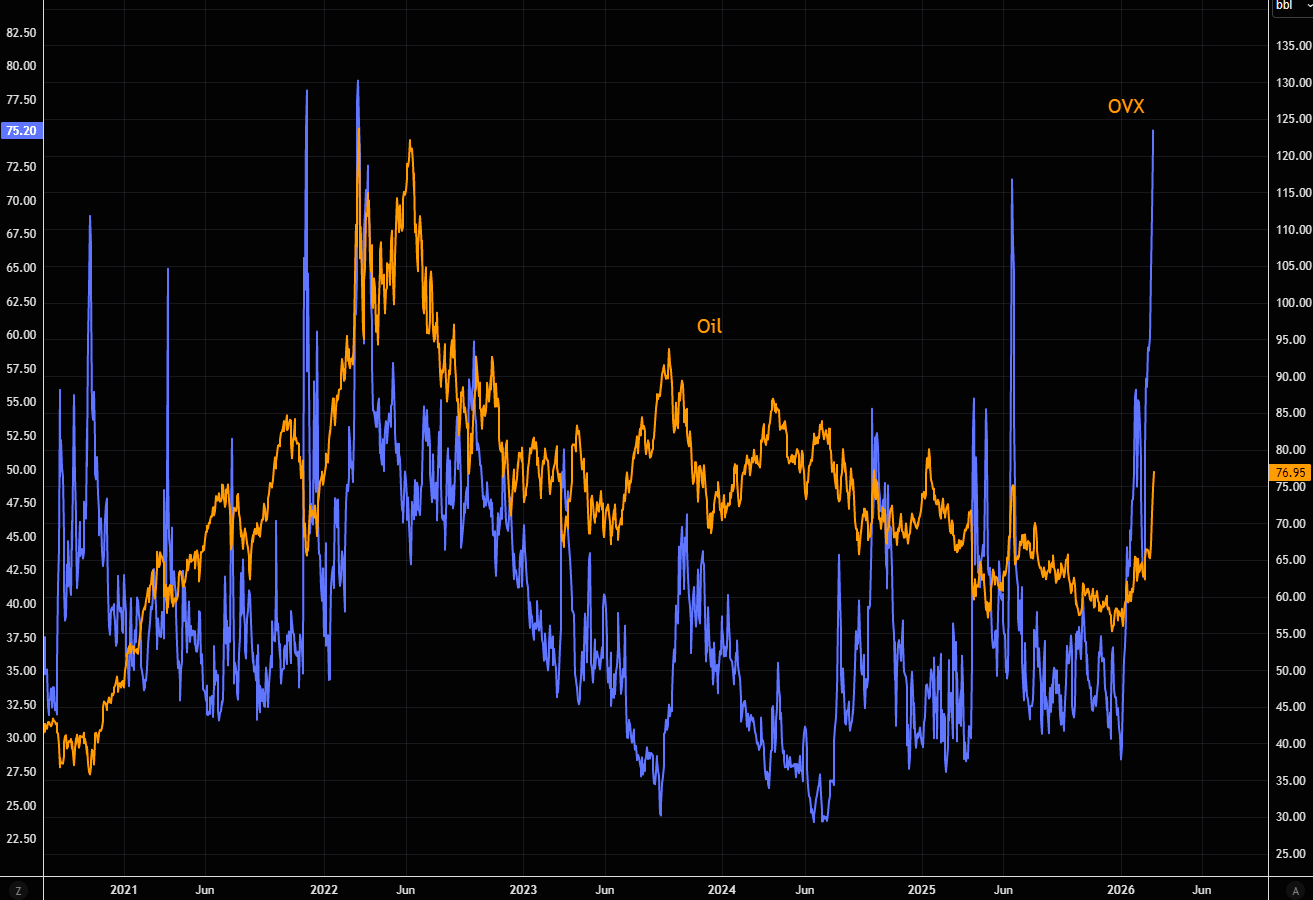
Stress is huge
Oil volatility, OVX, has exploded to the upside, closing at 75 yesterday. That implies almost 5% daily moves in crude going forward. Expect more erratic price action, as volatility shocks of this magnitude usually take time to feed through the system.
Source: LSEG Workspace
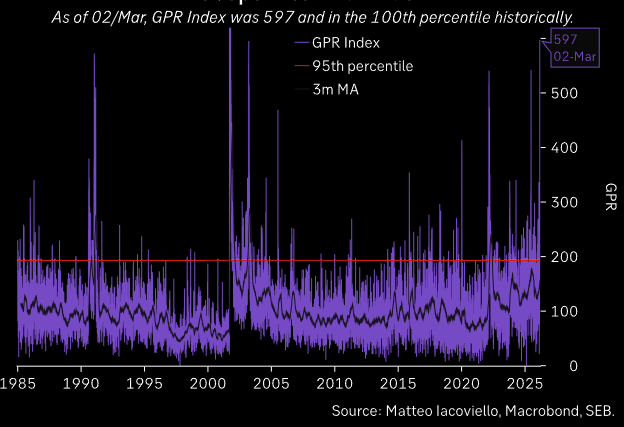
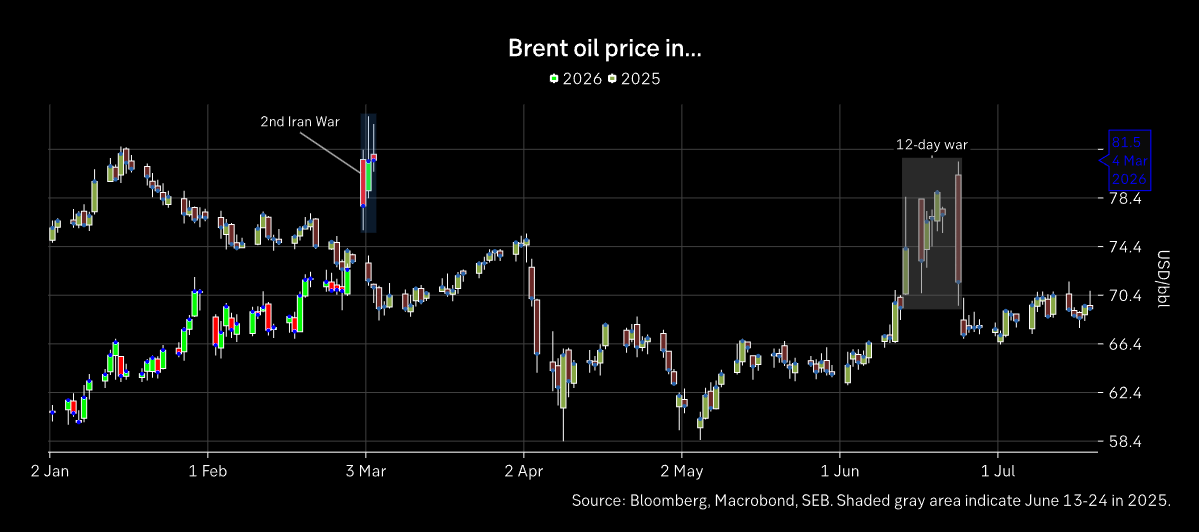
All about geopolitics
The geopolitical risk indicator is in the 100% tile.
Source: SEB
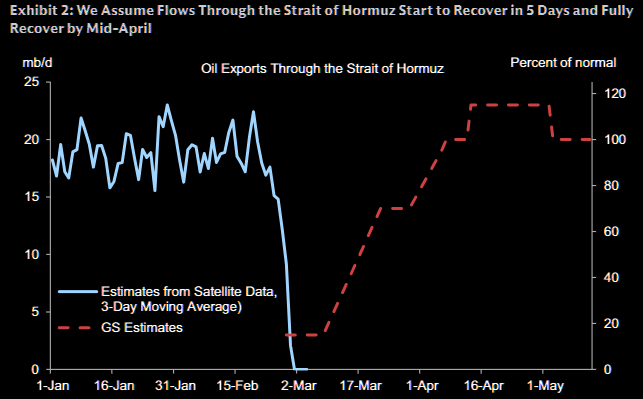
Raising
Goldman Sachs just raised its 2026 Q2 oil price forecast, lifting Brent to $76/bbl and WTI to $71. The key upside risk centers on longer disruptions to flows through the Strait of Hormuz, which could lead to significant supply losses and sharp inventory draws.
GS notes that if Hormuz exports remain severely disrupted for several more weeks, Brent could spike toward $100, a level that would likely require meaningful demand destruction to prevent inventories from falling to critically low levels. Lingering geopolitical uncertainty is also expected to keep a sizable risk premium embedded in oil prices.
Source: GS
Latest reactions
Pop first. Fade later.
Source: SEB
Somebody needs to pay
Oil and BWET speak for themselves. BWET is designed to reflect the daily price movements of indices that track the future cost of transporting crude oil.
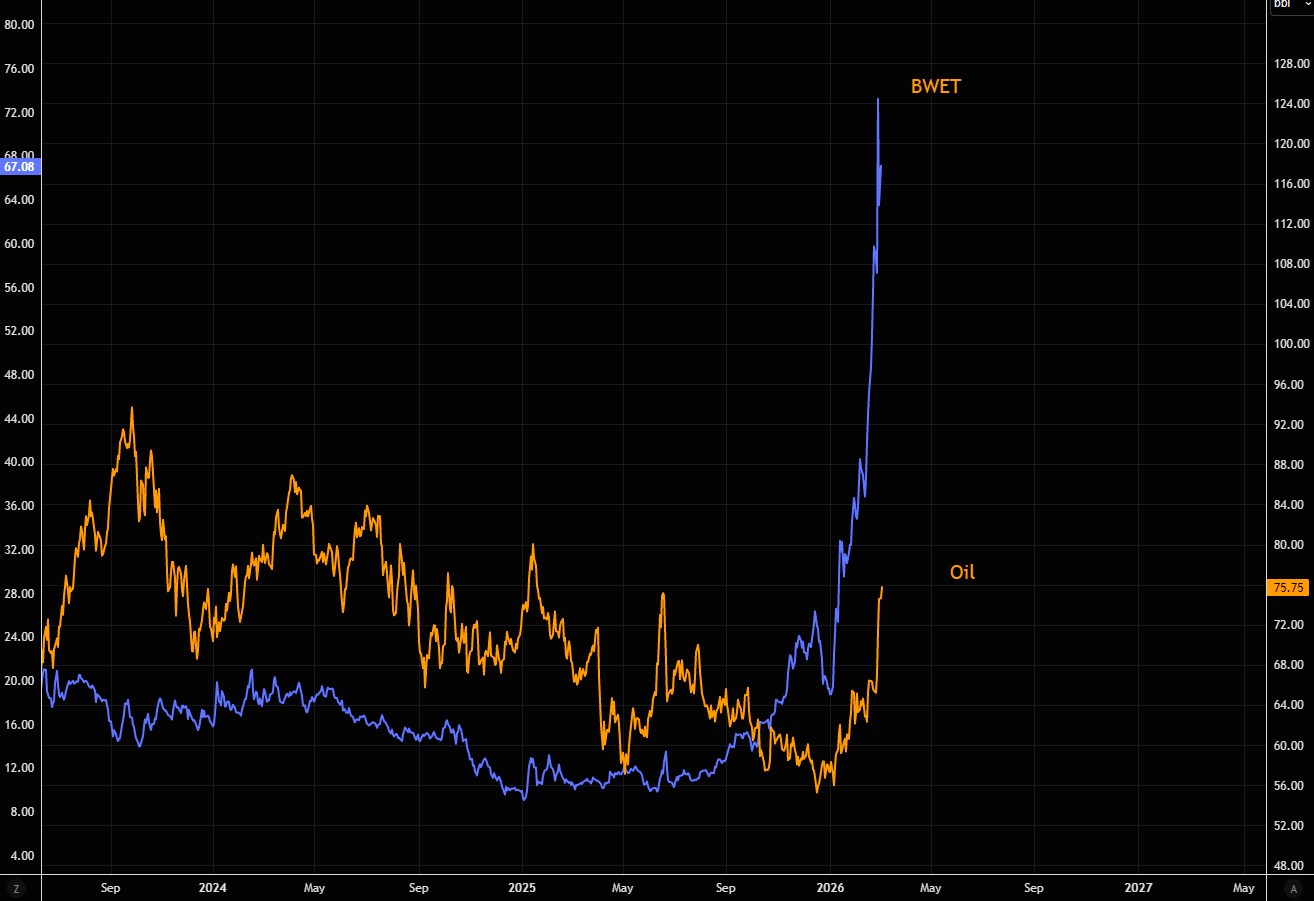
Source: LSEG Workspace
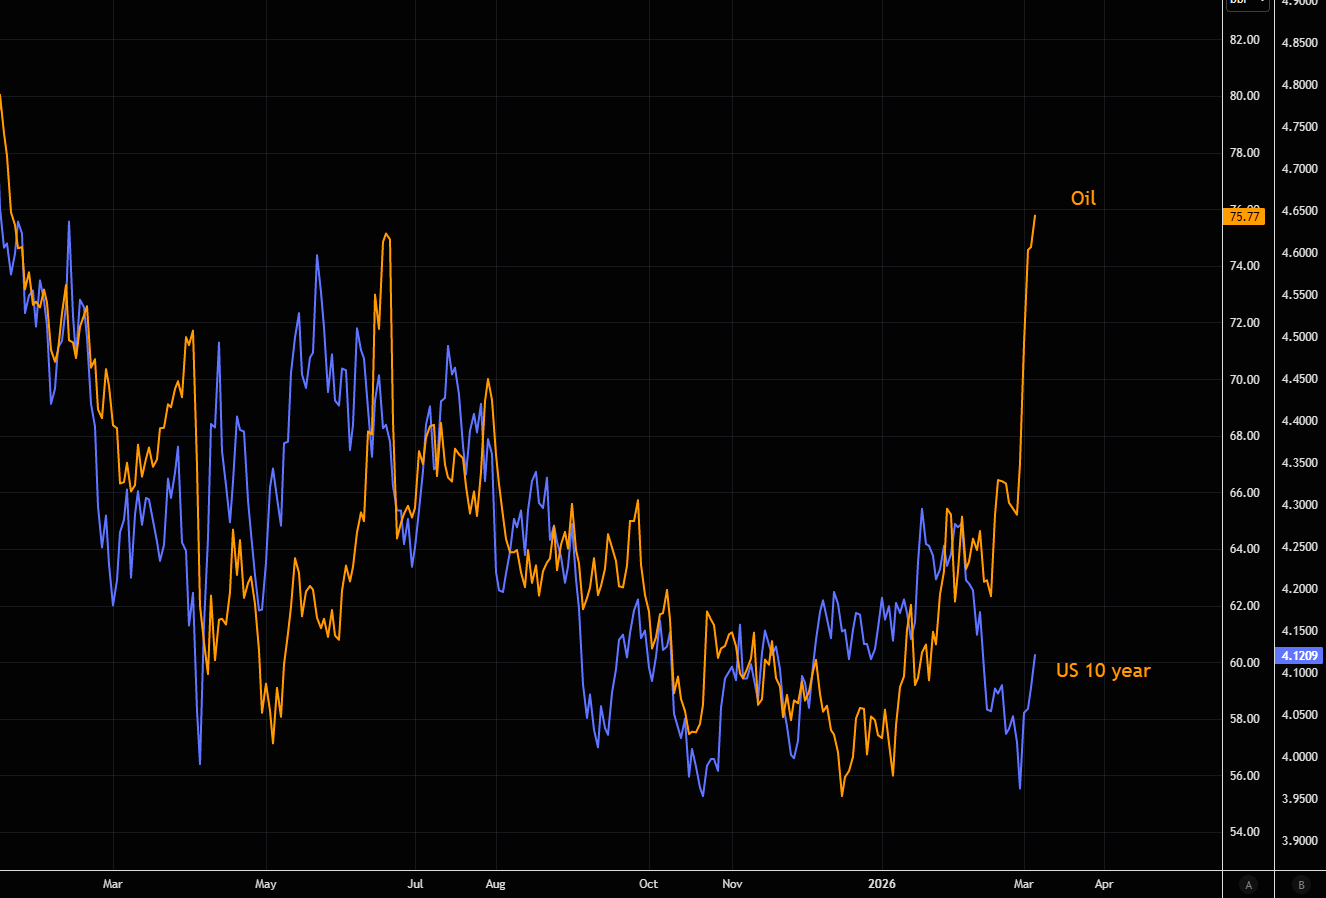
The rates connection
It wasn’t long ago that people were getting excited about the US 10-year breaching the 4% level, but oil changed that narrative. Let’s see how things play out, but with oil volatility elevated, expect continued erratic moves and more “confusion” across assets.