Oil Volatility, Short Gamma, And A Fragile Market
Main "stressor"
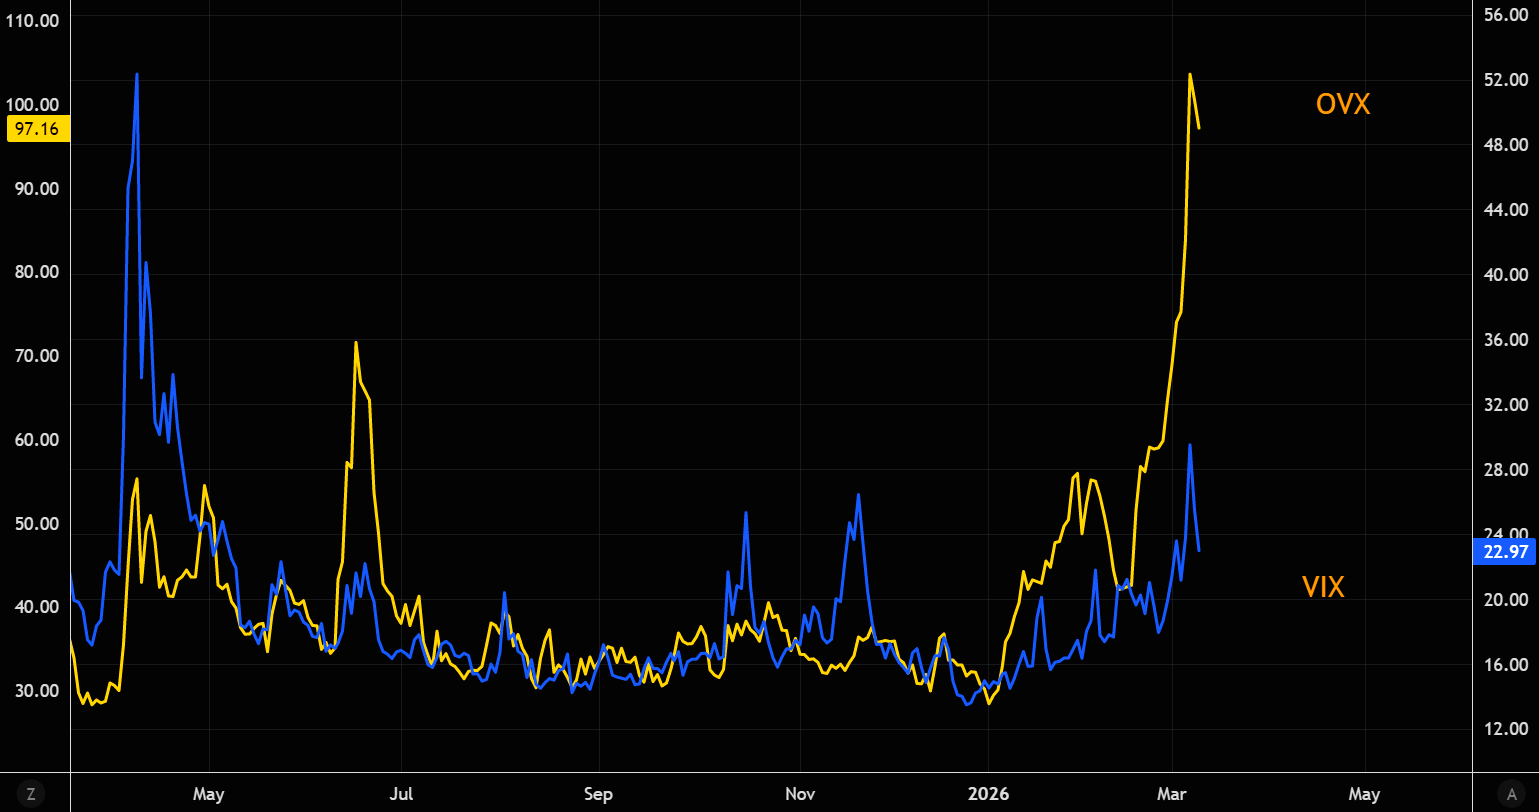
Oil volatility has been the epicenter of the latest market stress. While it has come off the panic highs, it remains at extreme levels. The last time VIX traded around these levels, OVX was significantly lower. The key question: can VIX really reset much lower from here while oil volatility remains this elevated?
Source: LSEG Workspace
The hedge unwind
The volatility market reaction to yesterday’s trading suggests significant hedge unwinds writes Goldman's volatility guru Garrett. Investors sold protection in size, leading to one of the largest underperformances of implied volatility (delta-adjusted) in more than two years.

Source: GS
Not what skew is saying
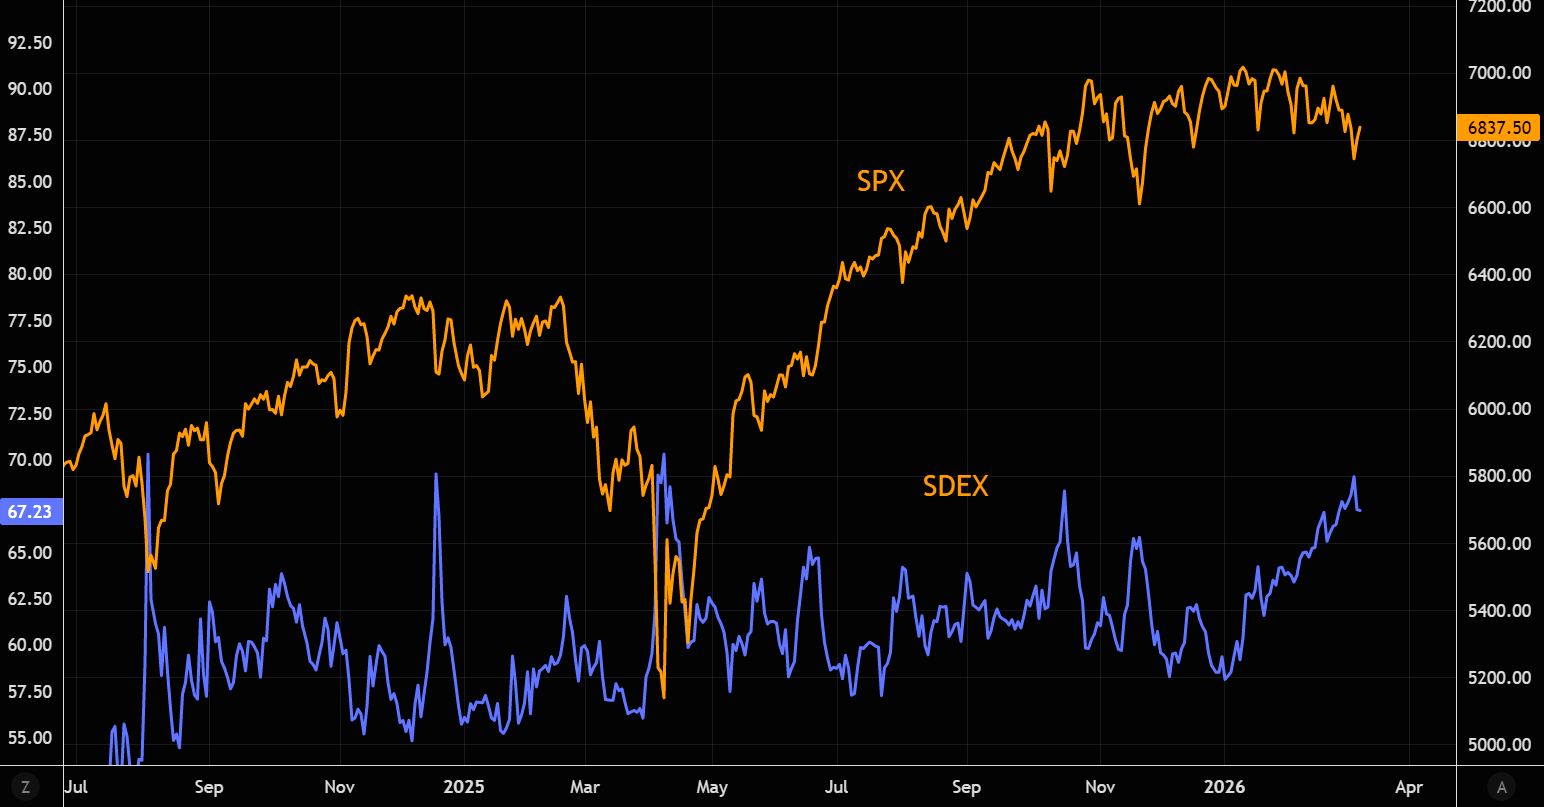
Investors unwound big hedges according to GS, but pricing of downside skew remains very elevated. More on this topic here.
Source: LSEG Workspace
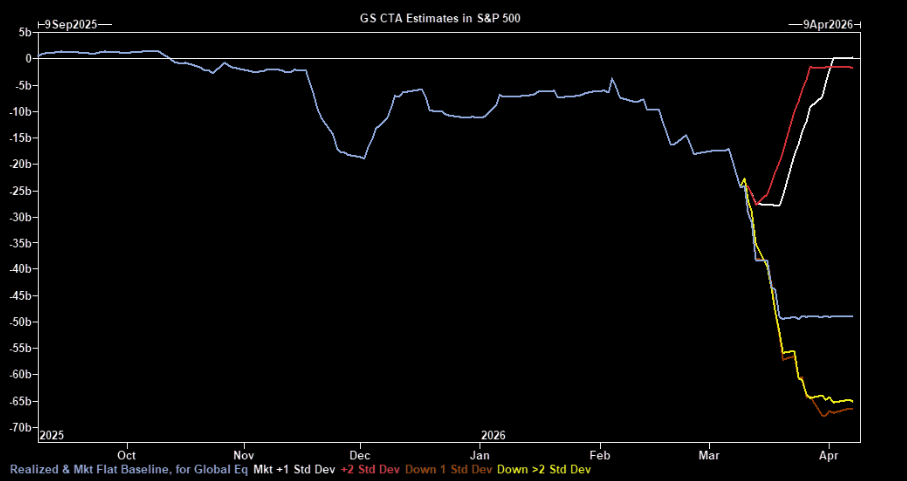
Sellers
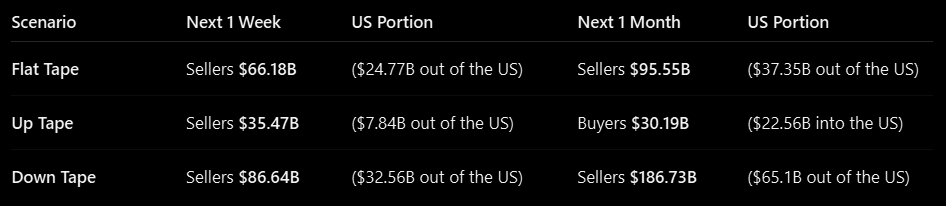
CTAs screen as sellers of equities across all scenarios over the next week and month according to GS. Estimated selling over the coming week is among the largest they have seen. Key SPX levels to watch: Short term 6894 // Medium term 6763 // Long term 6364. More on mechanical flows here.
Source: GS/TME
Source: GS
0th percentile
VIX options dealers are in the 0th percentile of gamma positioning, deeply short gamma. Moves could get messy quickly.

Source: Nomura

Source: Nomura
Fade the bounce?
Once the volatility reset fades and hedges are trimmed, US equities are actually not down much. The current rally may therefore be one to fade, as the larger issues remain unresolved, particularly the debate around AI and its impact on multiples and terminal valuations. At the same time, stresses in private credit, including fund gating and asset re-marking, continue to weigh on the broader credit complex. The macro backdrop is not helping either, with PPI running hot, CPI due tomorrow, and last week’s NFP print coming in negative. (Goldman's Privorotsky)

Source: LSEG Workspace
Europe feels the pain
Europe never stops to disappoint. BofA volatility team on Europe post the Iran war:
1. European assets have absorbed most of the spillover, including EU IG credit, equities, volatility and government bond yields.
2. This fits the fundamental story: Europe is far more energy dependent on the Middle East than the US.
3. The recent spike in natural gas prices is adding pressure. The DAX historically shows a strong negative correlation with gas prices.
4. Positioning likely amplified the selloff. At the start of the conflict, CTA exposure to European equities was much larger than to US equities.
(note all prices are as of yesterday mid day).

Source: BofA

Source: BofA
Software premium
Software continues to trade at a valuation premium to the equal weight S&P 500 despite the recent selloff... More charts on software here.

Source: FactSet
MSFT still out of favor
The stock trades round ~20x GAAP P/E on ‘27 and is now at/near 5+ years low relative to the market.

Source: Bloomberg
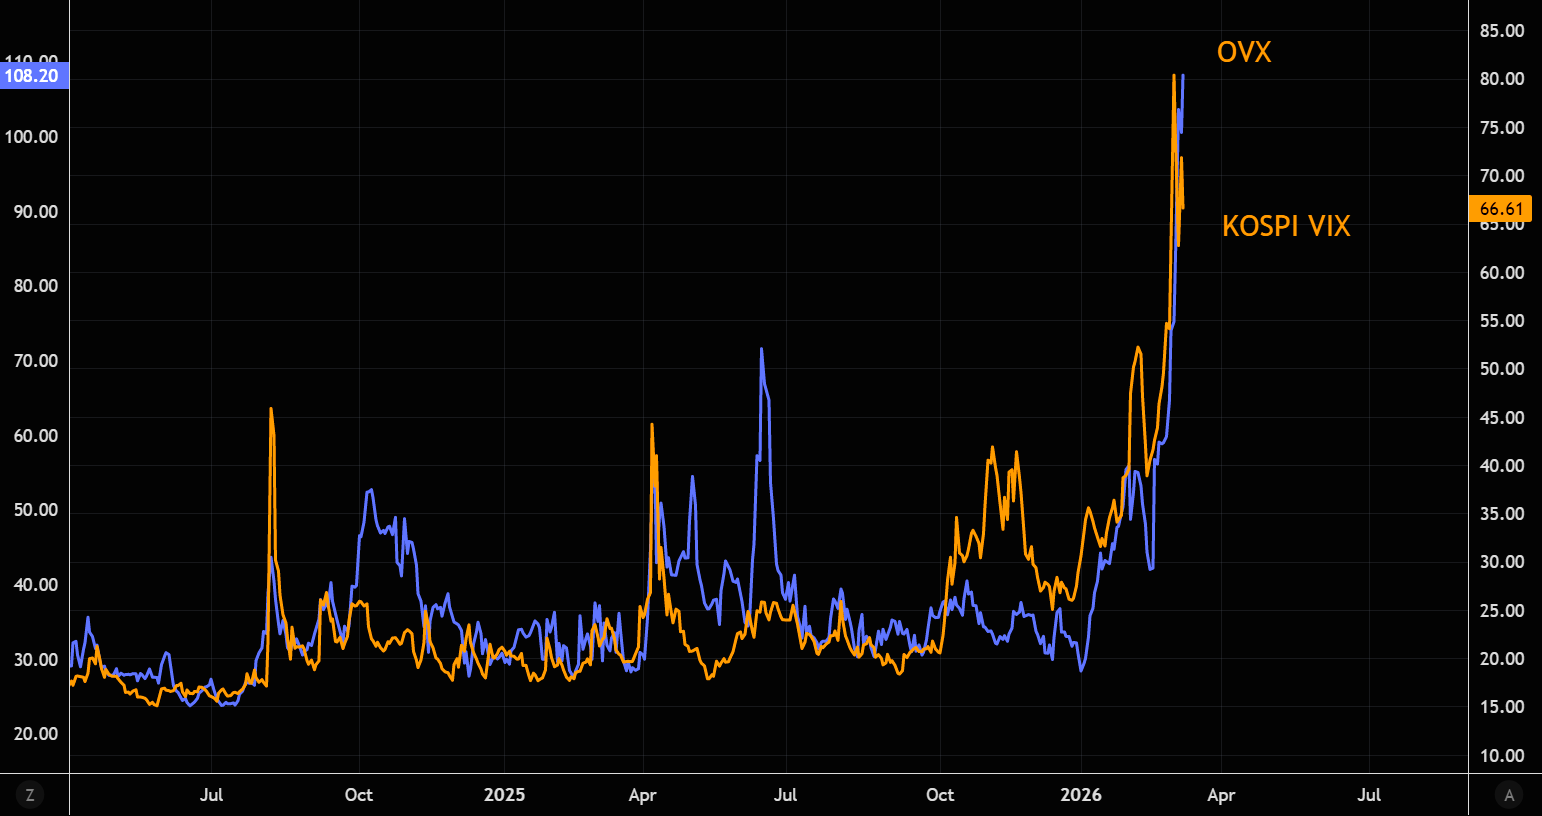
Trades like oil volatility
The KOSPI “VIX” currently trades more like an oil volatility proxy than a traditional equity vol index. Latest note on Korea here.