Stocks Still Stuck — Oil Volatility Remains Elevated
Not everything has calmed down
Oil is still trading at these new elevated levels, but above all, oil volatility (OVX) remains in pure panic mode.
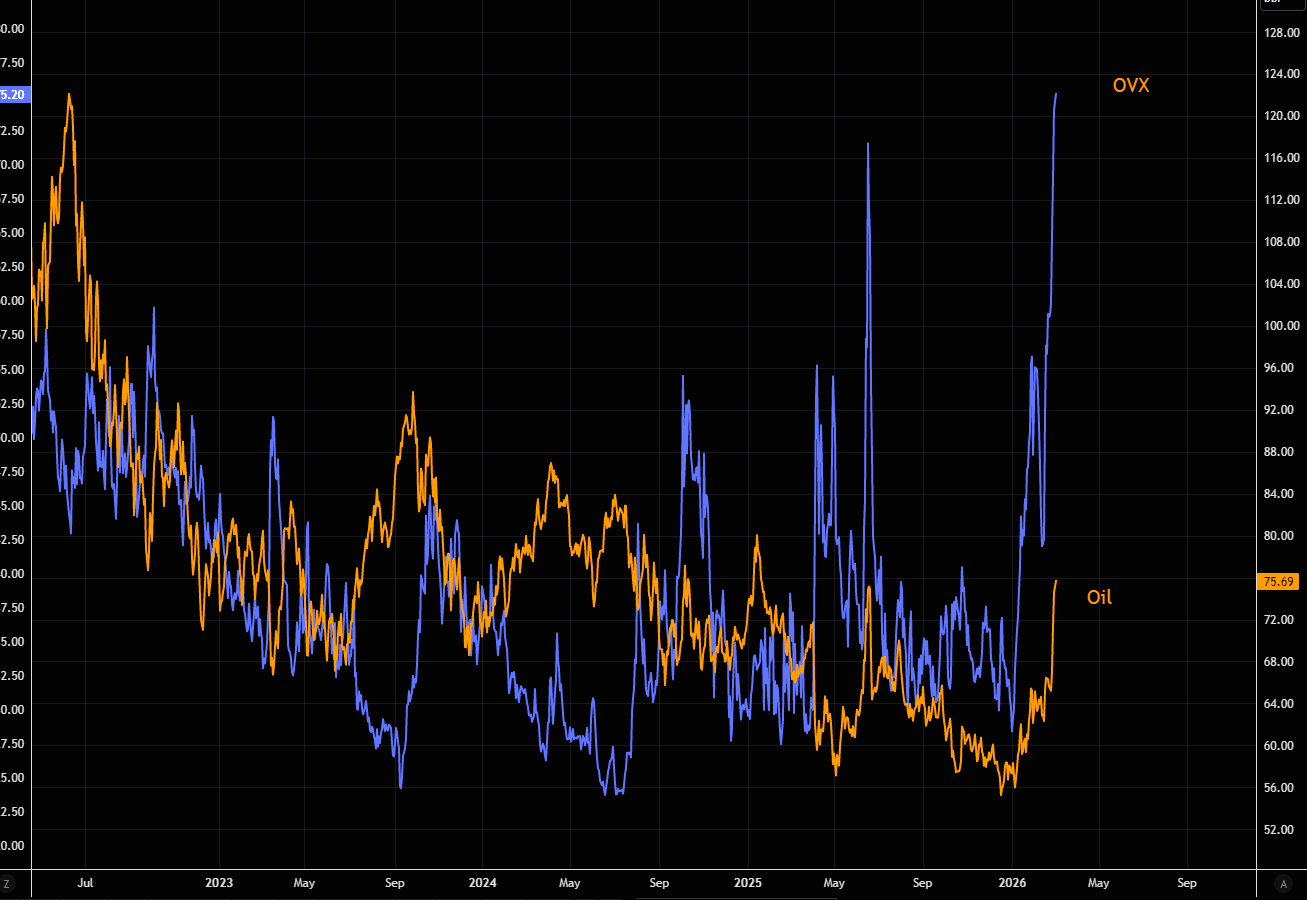
Source: LSEG Workspace
Will we…
…ever break out of that SPX range? The index has spent almost six months trading mostly within a 200-point range (with a few over- and undershoots). Impressive given the many under-the-hood moves and the latest political chaos.
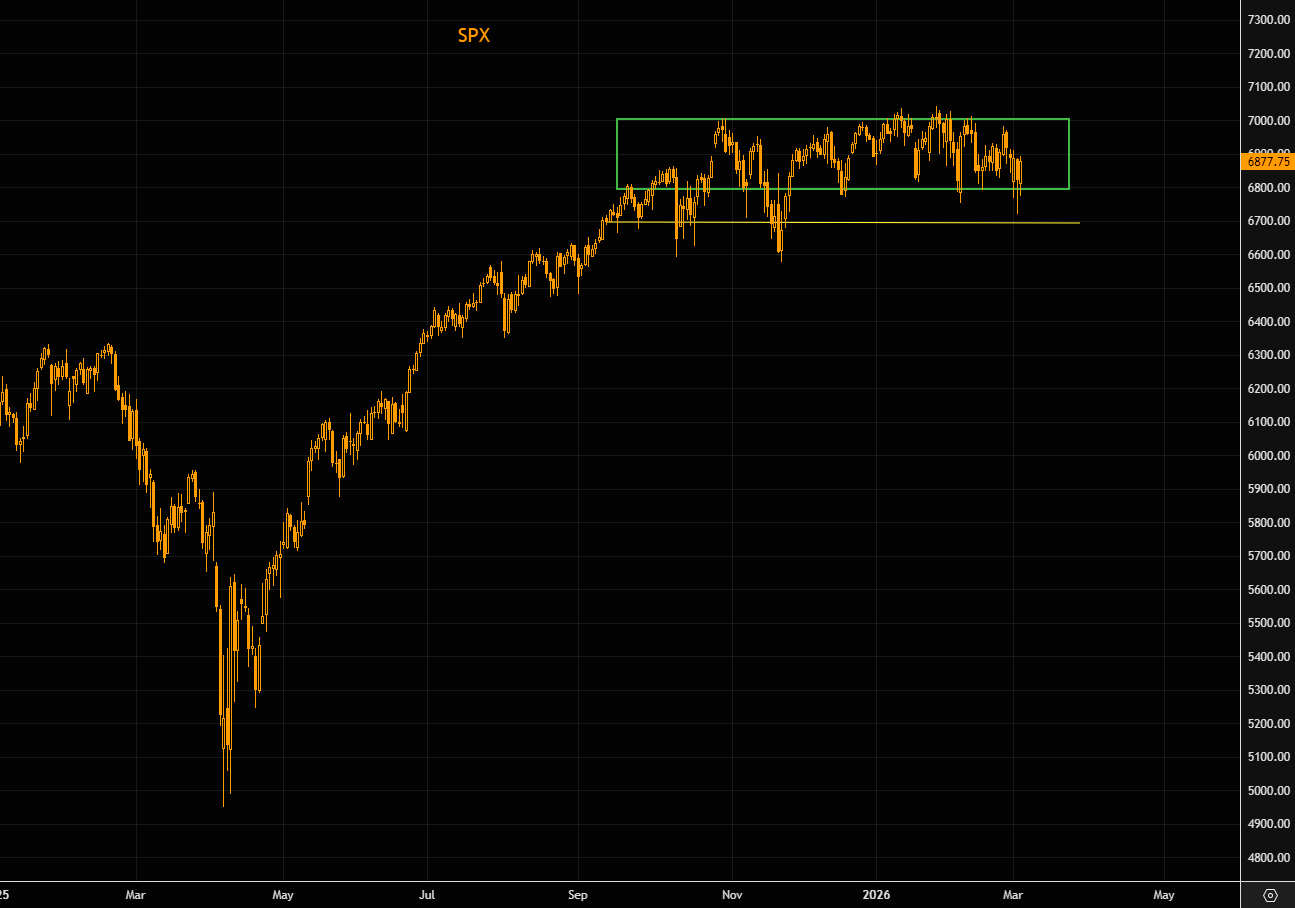
Source: LSEG Workspace
"Attractive set-up"
"The reduction in risk over the past few weeks, alongside the recent moves, has caused our US Tactical Positioning Monitor to signal an “attractive” set-up (i.e., US stocks could bounce a bit). Notably, this is mostly due to changes in prior weeks as the 4wk change now sits at -1.7z on a 3d avg basis, below the -1.5z threshold, even though the 1wk change is less negative at -1.4z". Read the full note here.
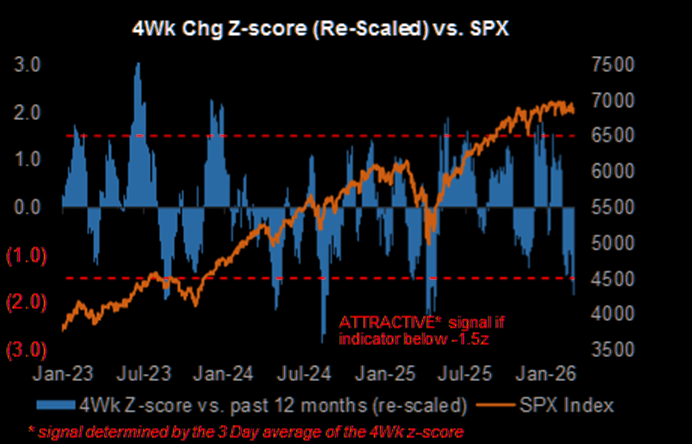
Source: JPM PI
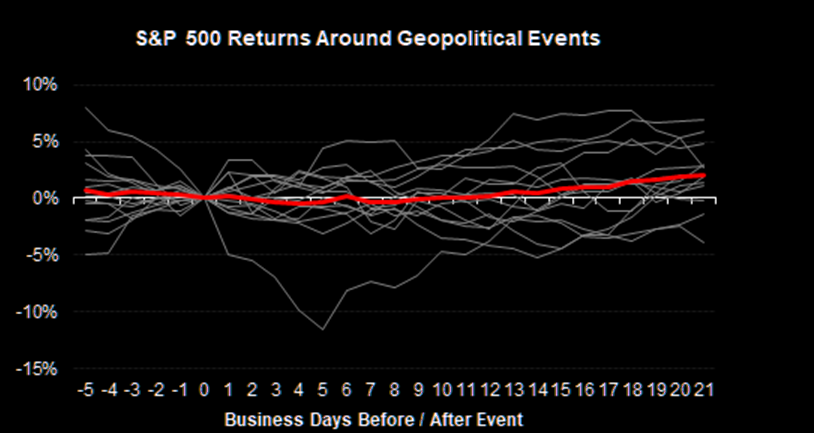
US equities are generally resilient to conflicts
MS: "While this is not an exhaustive study, based on 14 events over the last few decades (generally major, as well as some recent smaller Iran related incidents) the S&P 500 is generally range bound following the start of a conflict. The event causing the largest drawdown in this sample was September 11th, 2001."
Source: MS QDS
Terrible tech
We have of course seen one of the weakest periods of relative returns for technology compared with other sectors over the past 50 years.
Oppenheimer: "Recent anxiety about tech valuations, capex plans and the disruption to business models (particularly in areas around software) has resulted in a de-rating of longer-duration cash flows in favour of more certain nearer-term returns in physical capex and infrastructure." More here.
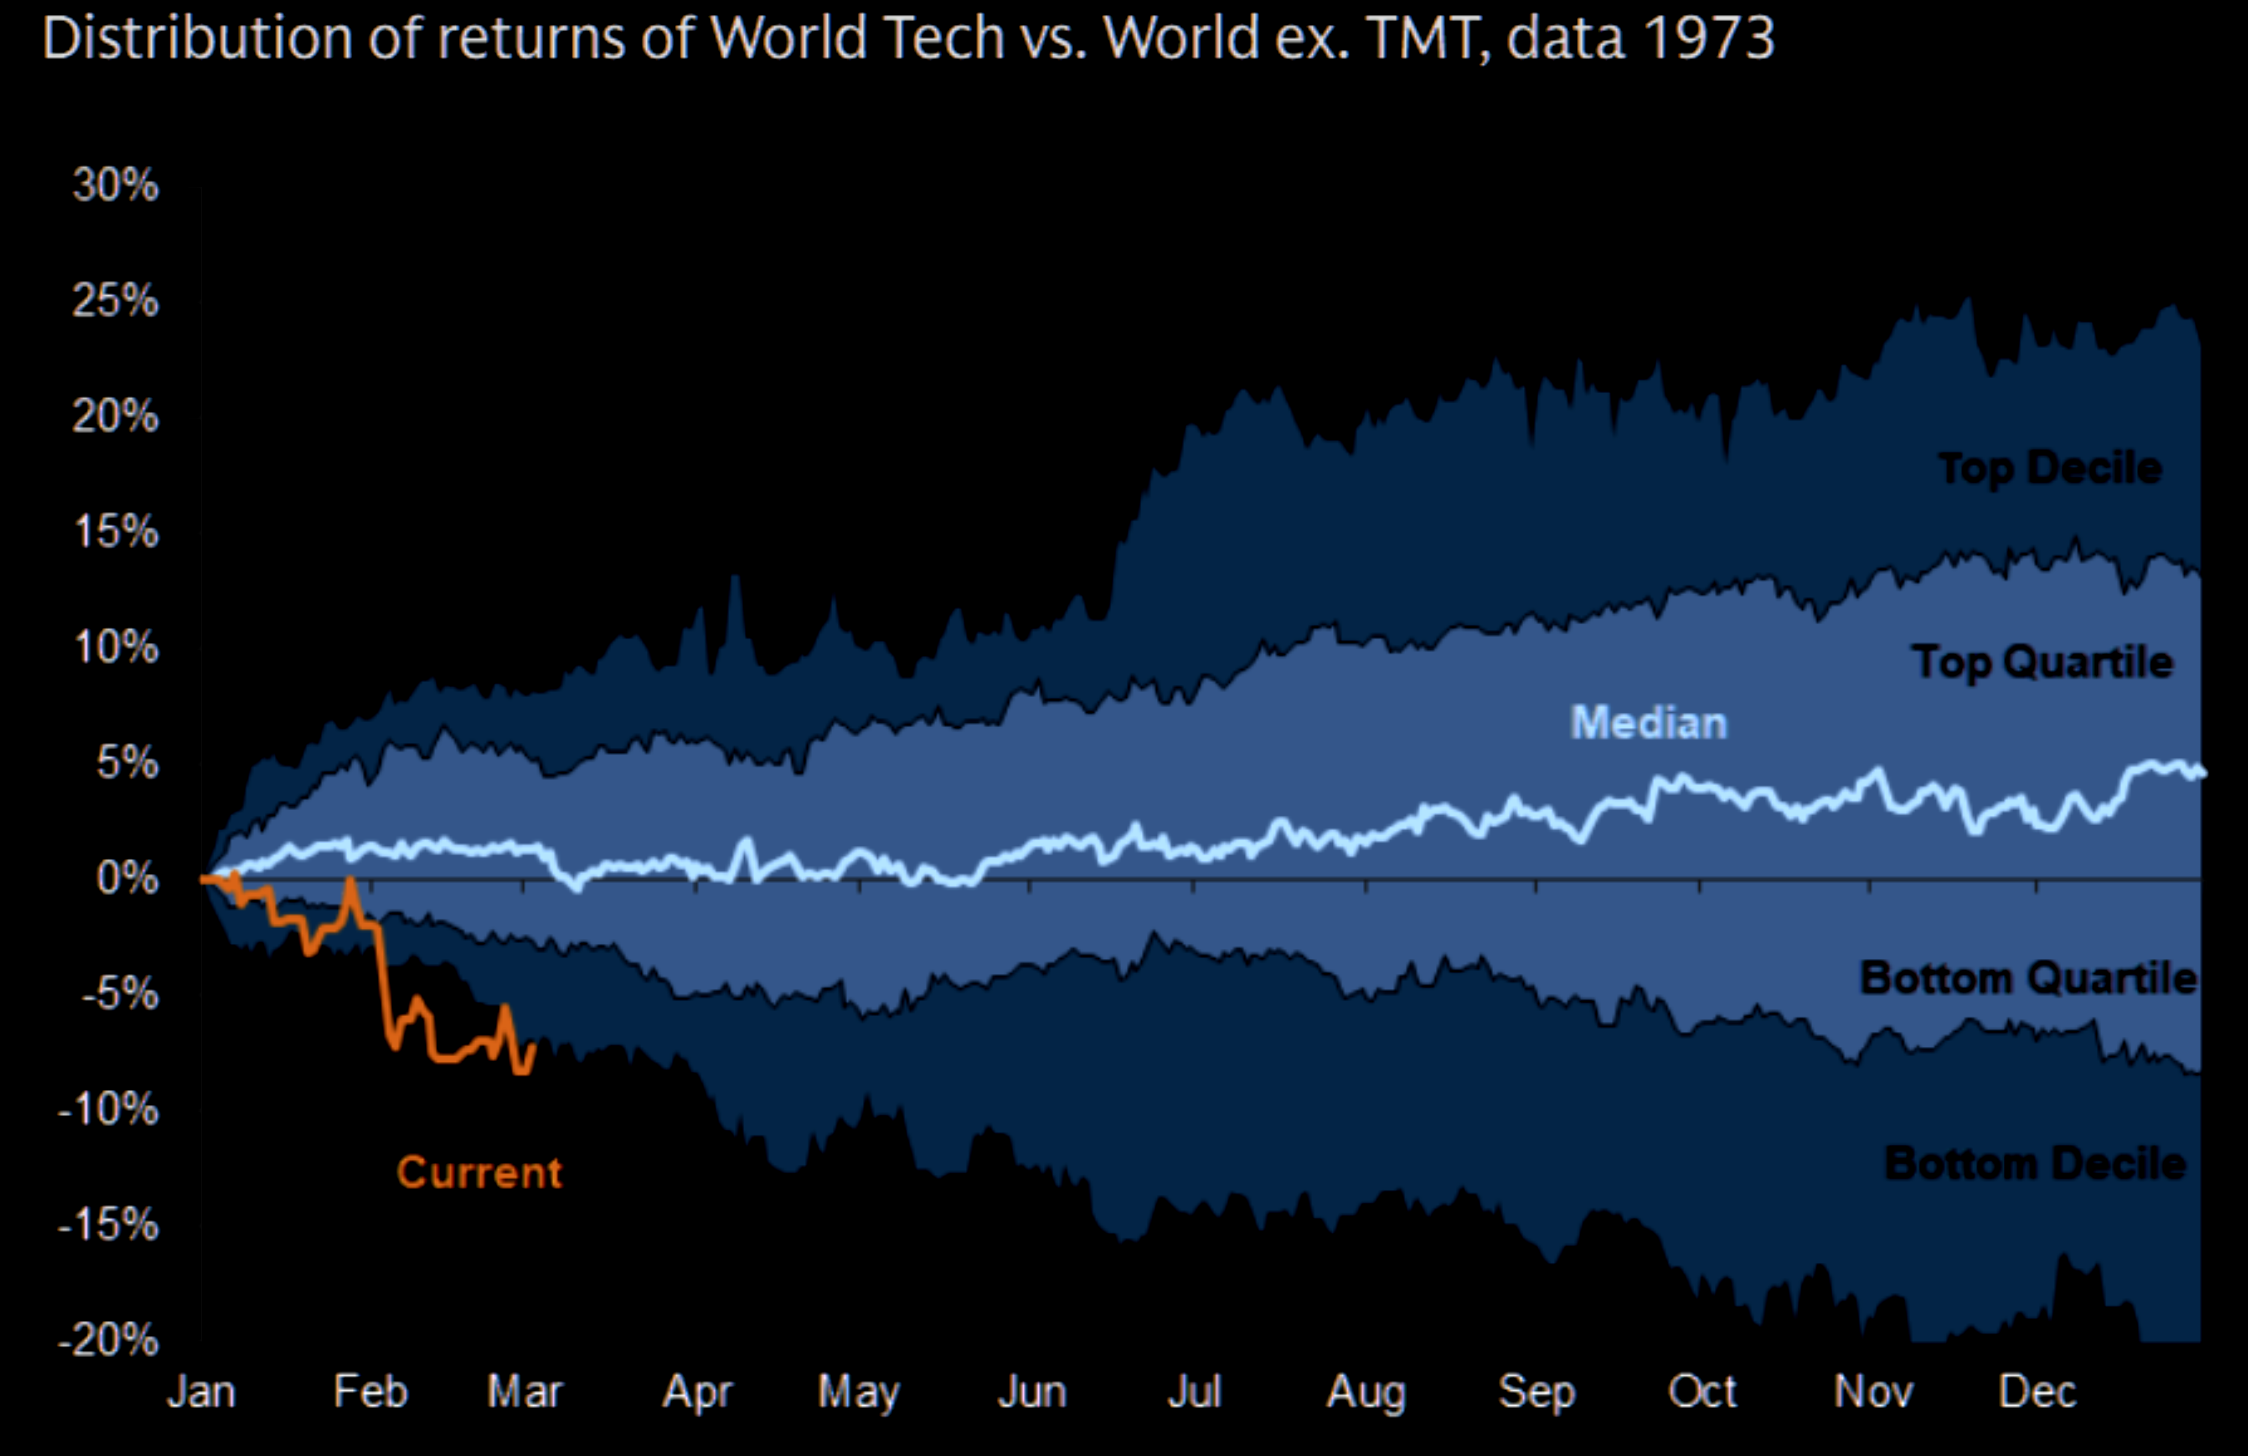
Source: Datastream
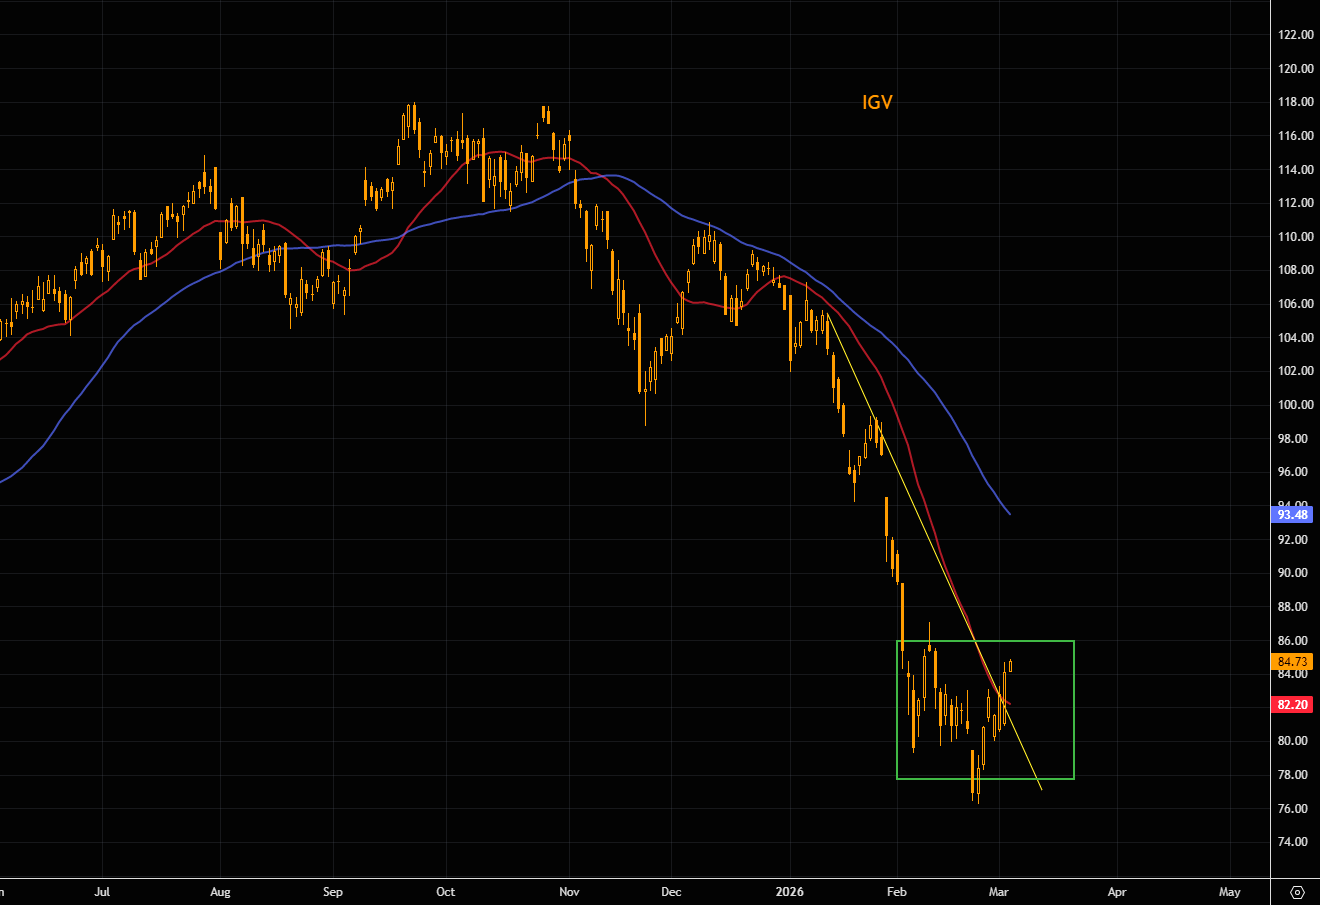
Remember software?
IGV has pushed above the short-term negative trend line and is now trading above the 21-day moving average. A close above the $86 area could open the door for a further squeeze. There is little resistance until the 50-day moving average around $94.
Source: LSEG Workspace
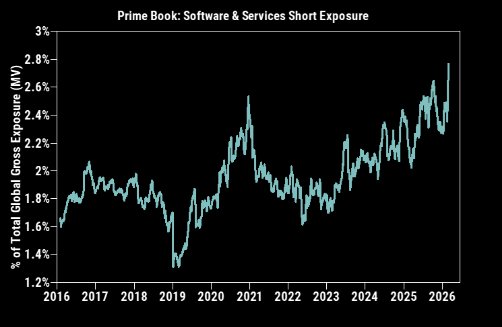
The big short
The Software shorty is absolutely massive. More on both software as well as semis here.
Source: GS
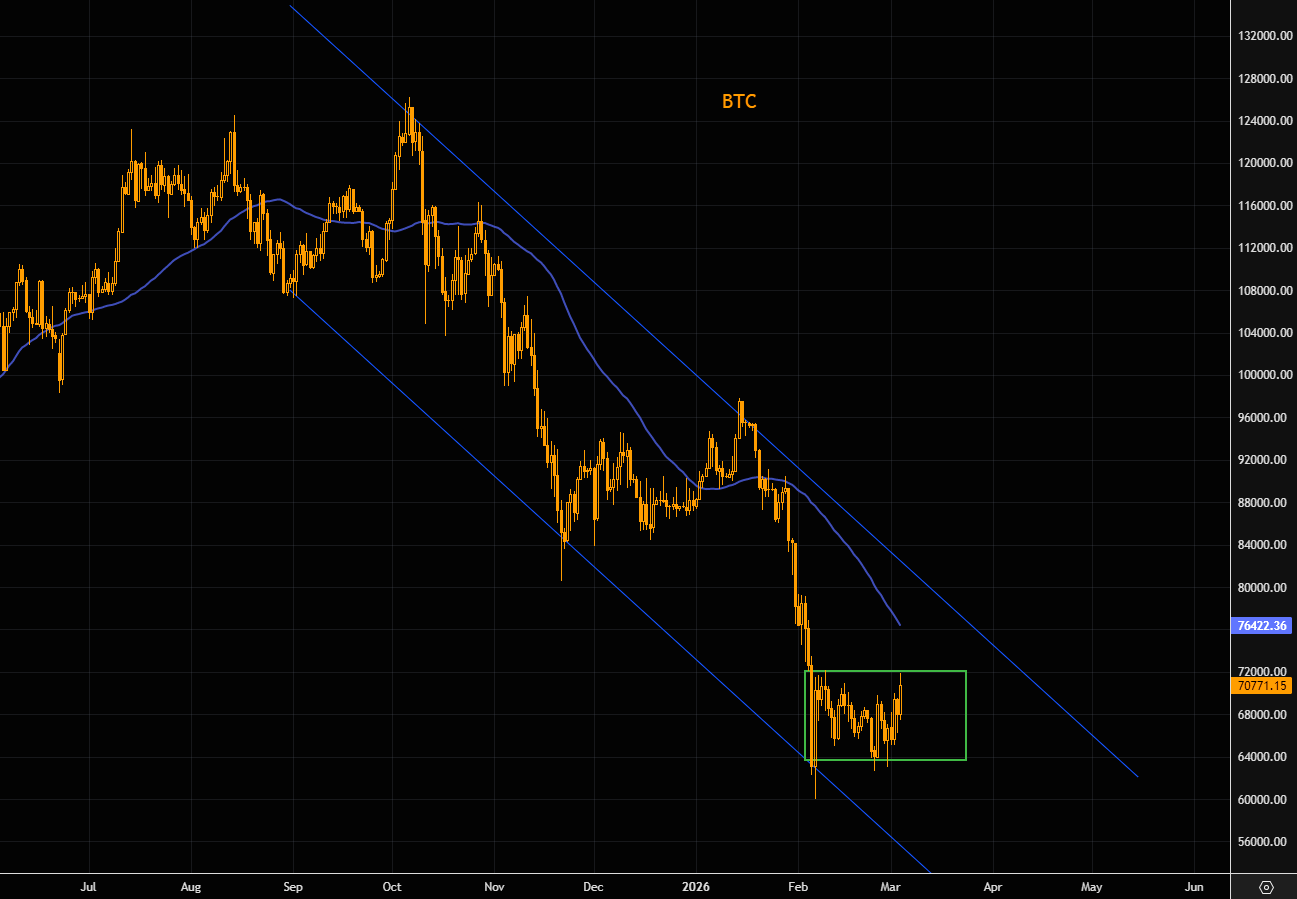
Bitcoin quietly brewing
BTC has shown notable resilience during the latest bout of market chaos. BTC is pushing the highest levels since early February. Note that BTC is still stuck inside the range that has been in place since late January. A break above $72k would be the first real technical signal that the consolidation is ending, opening the door for a test of the bigger channel highs and the 50 day MA (currently around $76k). Latest note on BTC here.
Source: LSEG Workspace
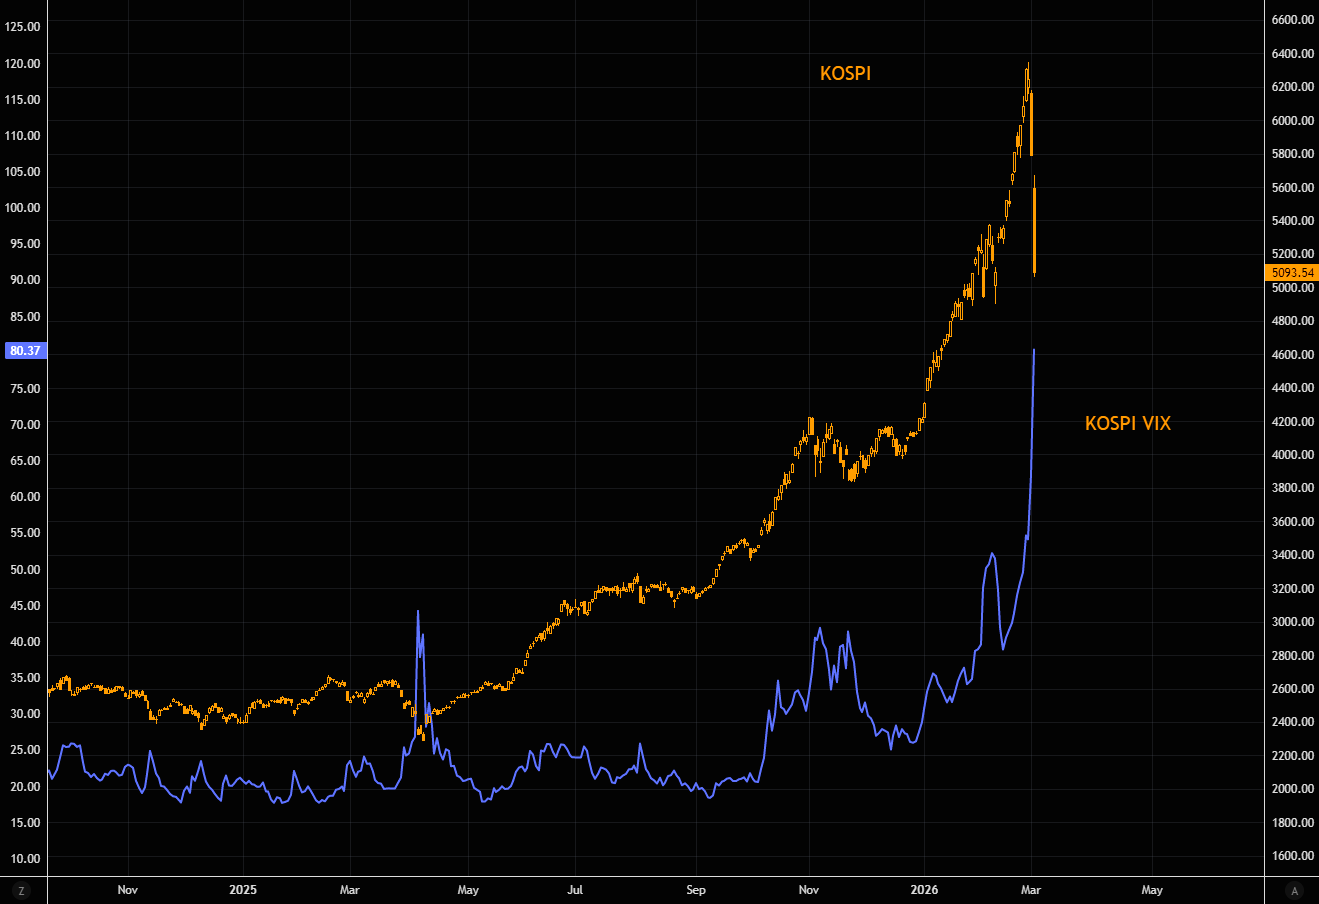
For the record books
KOSPI volatility has flipped from spot up, vol up to crash down, vol up. The KOSPI “VIX” surged to 80 overnight, implying roughly 5% daily moves ahead. That is extreme for an index, even after the overnight collapse. In just three sessions the market has gone from upside panic to pure downside panic. All Korea panic charts here.