Ten Charts That Caught Our Eye
Risk-positive
The Morgan Stanley Risk Signal has turned positive, exiting the risk-off signal reading it has held since Feb 27th 2026.
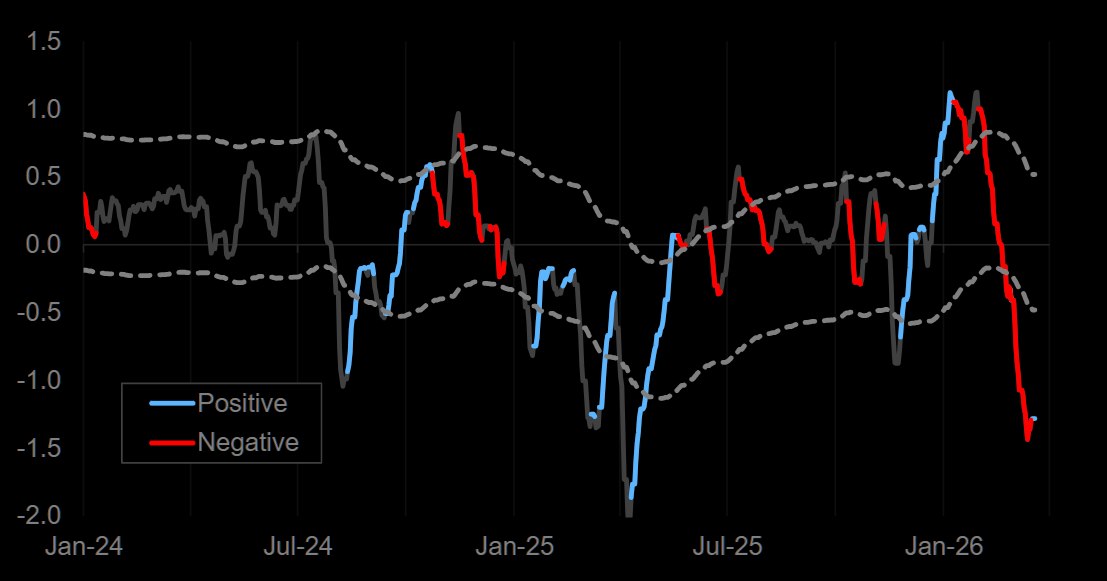
Source: Morgan Stanley
Risk negative
Credit Agricole FX: "Our Risk Index remains deep in risk averse territory."
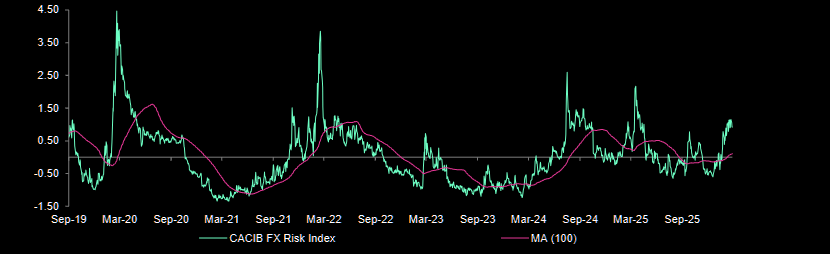
Source: C-A FX
Pearl Harbor
Wars rarely pose a long-term threat. Chart shows S&P500 after US military involvement since WWI. Not even 6 months of bear even after Pearl Harbour.
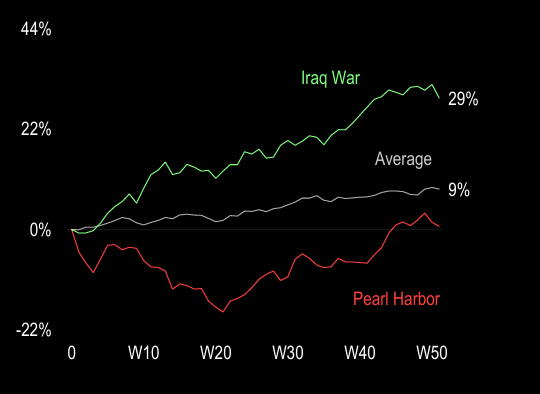
Source: Numera
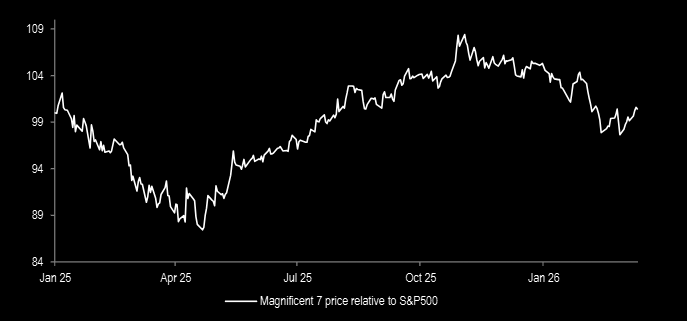
The group formerly known as Magnificent
Here is Mag 7 relative the market since Jan ‘25. This group does of course hold the main key to the future performance of the overall market.
Source: JPM Equity strategy
Will NVDA multiple ever re-expand?
Related to the previous section about the Mag7 stocks we also of course need to look at the most important stock of those seven - at one time called the most important stock in the universe. The chart shows Nvidia’s P/E multiple against Nvidia’s stock price.
Peter Callahan: "...ongoing debate in the market has been around the ‘de-rating’ in NVDA since last Fall (Oct/Nov’) and what gets the multiple to stabilize (.. let alone, re-expand...)."
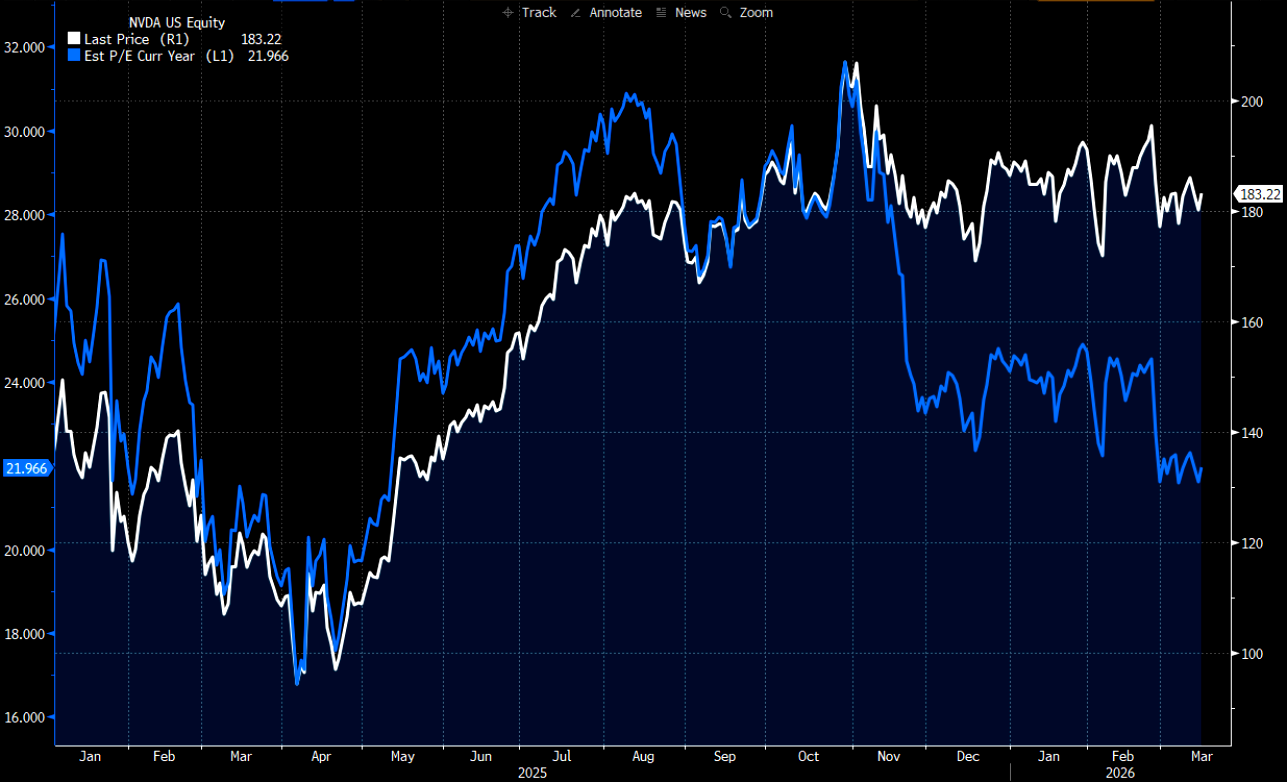
Source: Bloomberg
Japanese yields back near multi-decade highs
Markets have pushed rates back near their highs and USDJPY to nearly 160, not far from the multi-decade high set in summer 2024.
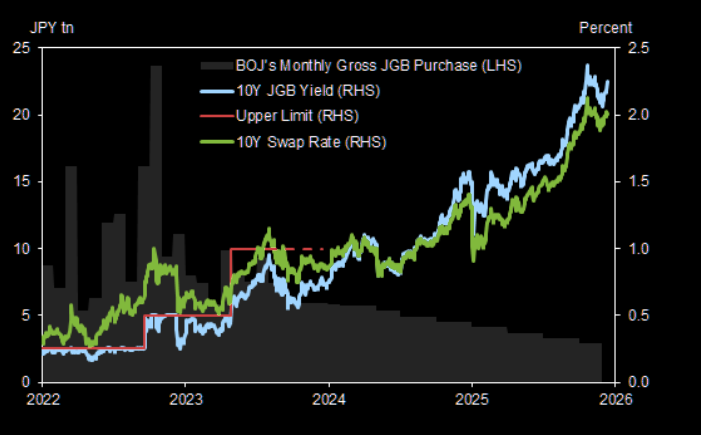
Source: Datastream
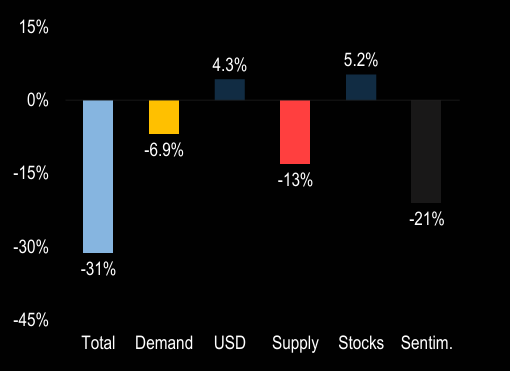
GS below consensus on growth
For the better part of the past two years, Goldman has been very bullish growth and above consensus. Not anymore.
Goldman: "Our 2026 Global Real GDP growth forecast now stands at a below-consensus 2.6%."
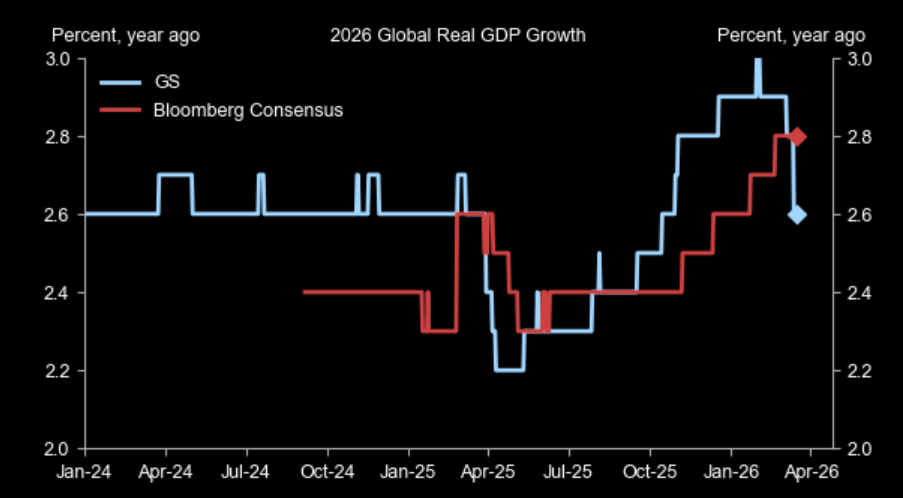
Source: Goldman
Oil: Geopolitical risk can fade quickly
Does not feel like it today but worth remembering that oil also can trade down on geopolitics. Brent fell over 30% in late 1990, as Saudi and other OPEC members ramped up production to offset the Iraq + Kuwait shortfall. This lowered oil prices directly, and eliminated the geopolitical risk premium.
Source: Numera
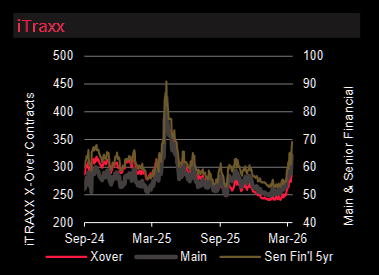
Credit is getting attractive
Soc Gen: "The recent widening means current levels are starting to look attractive. Spread to benchmarks and ASW spreads are at the widest levels in over eight months and credit yields are now at the highest levels in 20 months. If the conflict is set to be short lived, these levels are becoming very attractive."
Source: Soc Gen Cross-Asset
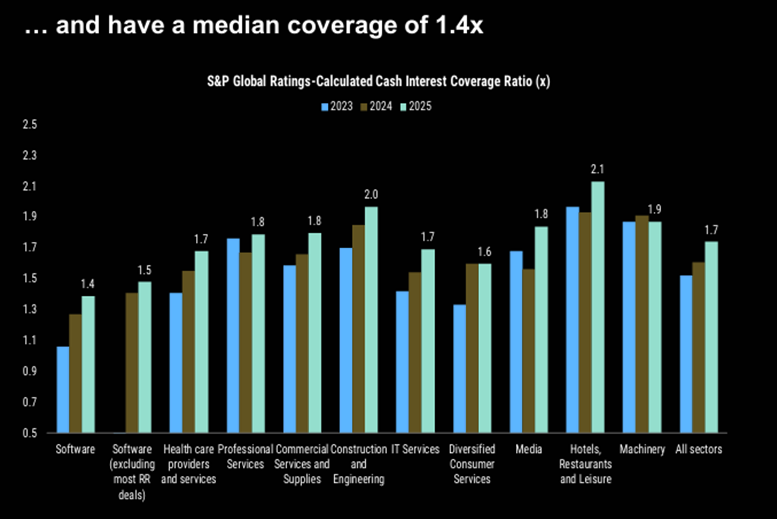
Software like CCC
In terms of "Private Credit" it seems like software is more like a CCC credit. Software screens the highest in leverage, and lowest in coverage. And more broadly, private credit borrowers are more comparable to low single B/CCC profiles in public market.
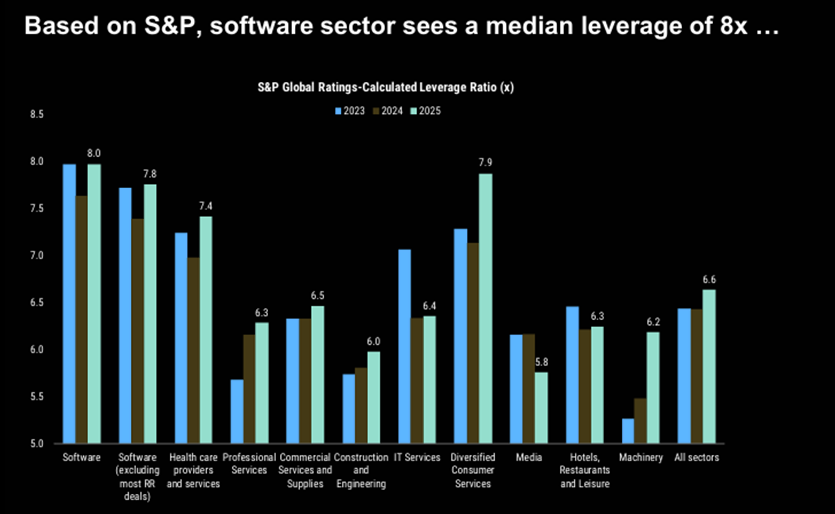
Source: S&P