Three Charts to Watch: What If MOVE Starts to Move?
The 10 year and MOVE
The U.S. 10-year continues to trade within the trend channel in place since the October lows. 4.2% remains a major support level to watch. Bond volatility (MOVE) has been dormant for a long time, but note the recent uptick.
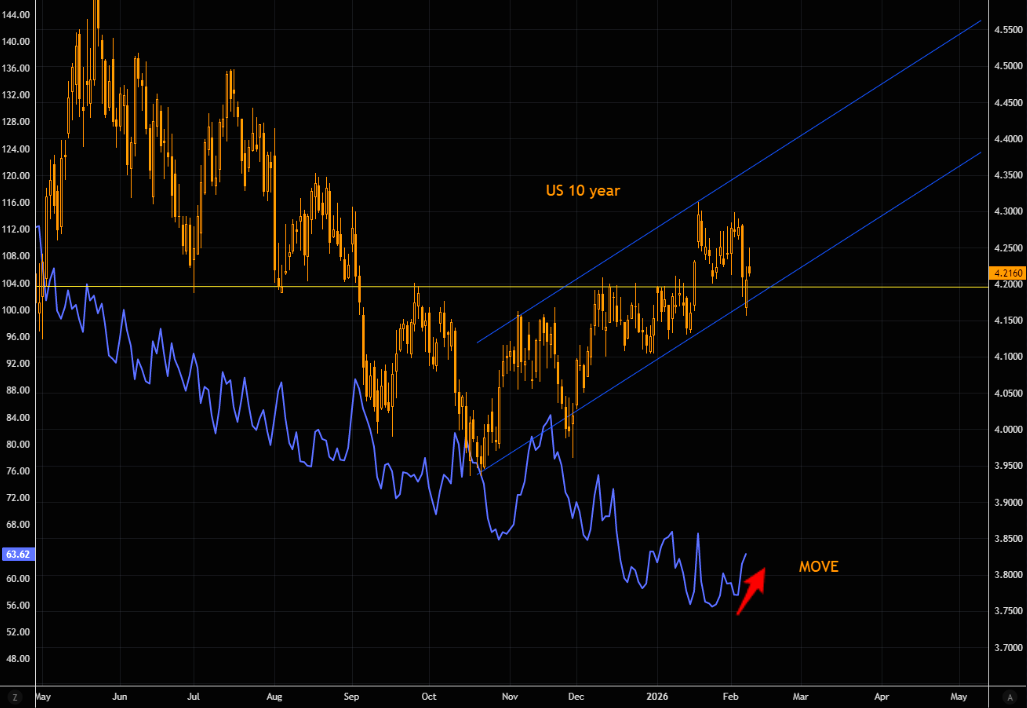
Source: LSEG Workspace
Bond vs equity vol
Bond volatility has been resetting for almost a year now and the gap vs VIX has gotten wider lately, despite the little uptick in the MOVE index. Chart 2 shows bond vs NASDAQ volatility.
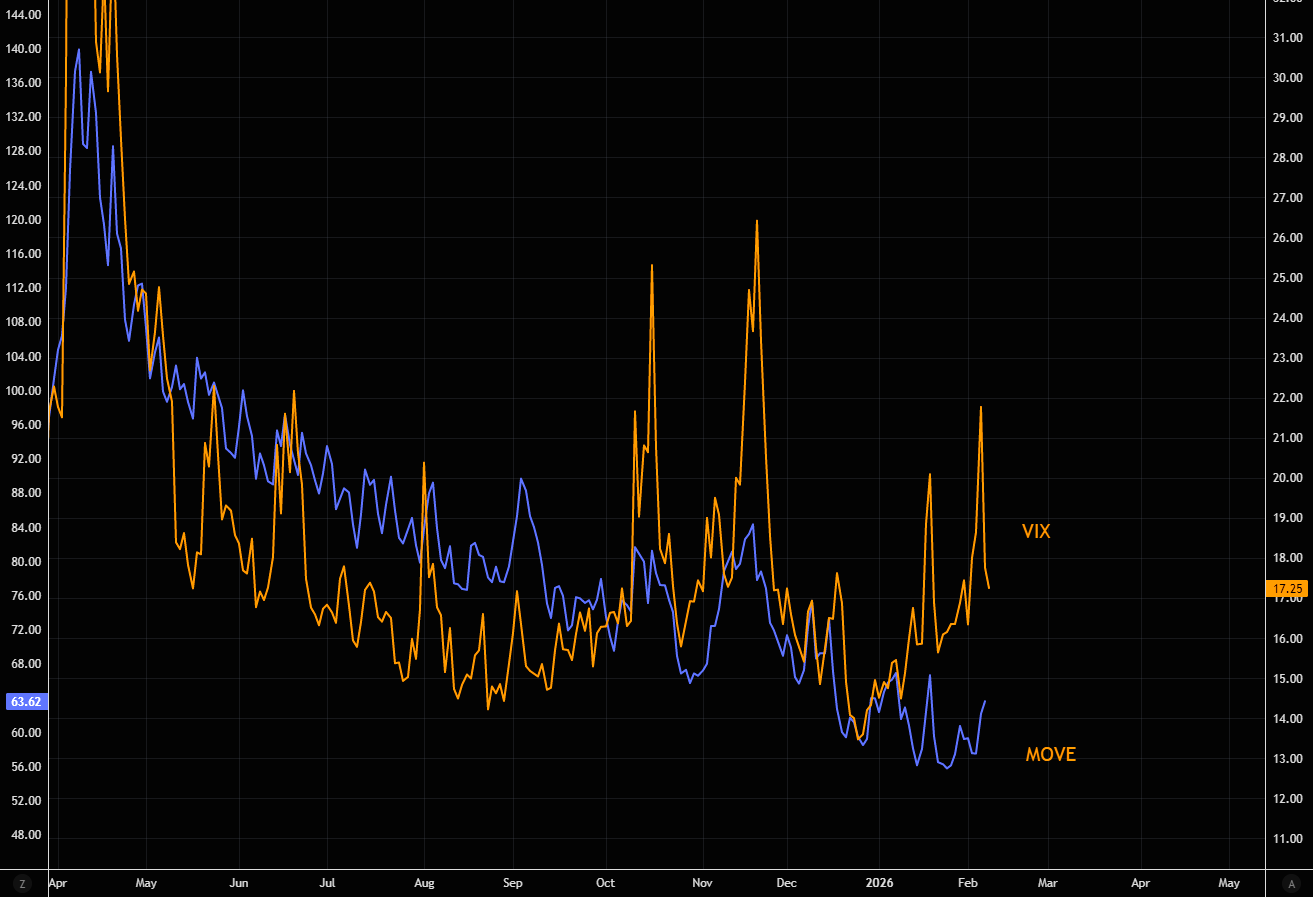
Source: LSEG Workspace
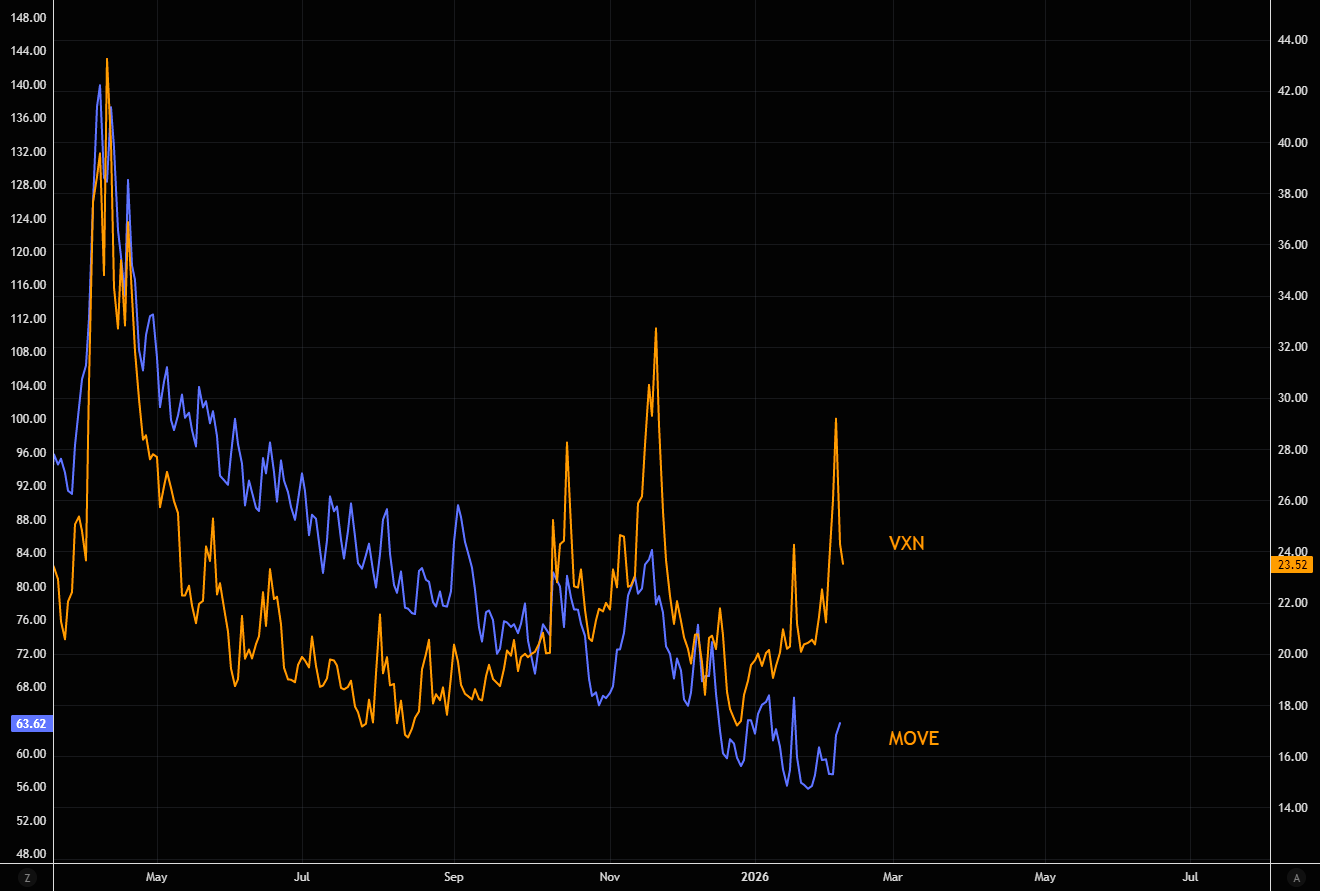
Source: LSEG Workspace
Perfection
SPX and MOVE (inverted) have traded in perfect tandem since "forever". Let's see how this plays out, but the last little uptick in MOVE should be watched closely.
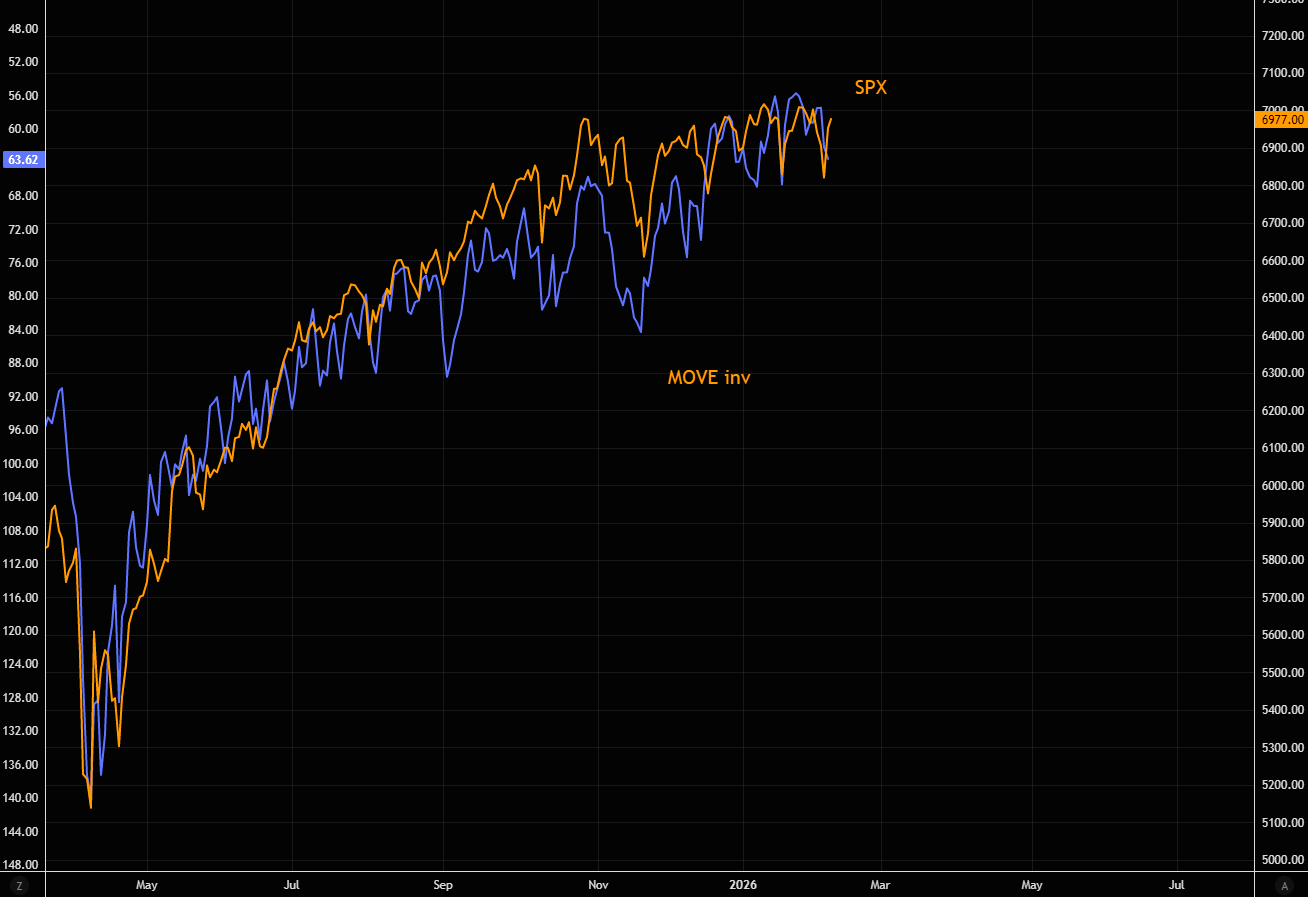
Source: LSEG Workspace
Loading...