Trust the Perfect Netscape Trajectory Or the Flashing Sell Signals?
Nothing NASDAQ
NASDAQ is in the middle of the range, trading at the same levels we traded at in late Nov, early Nov, late Oct, early Oct... you get the point.
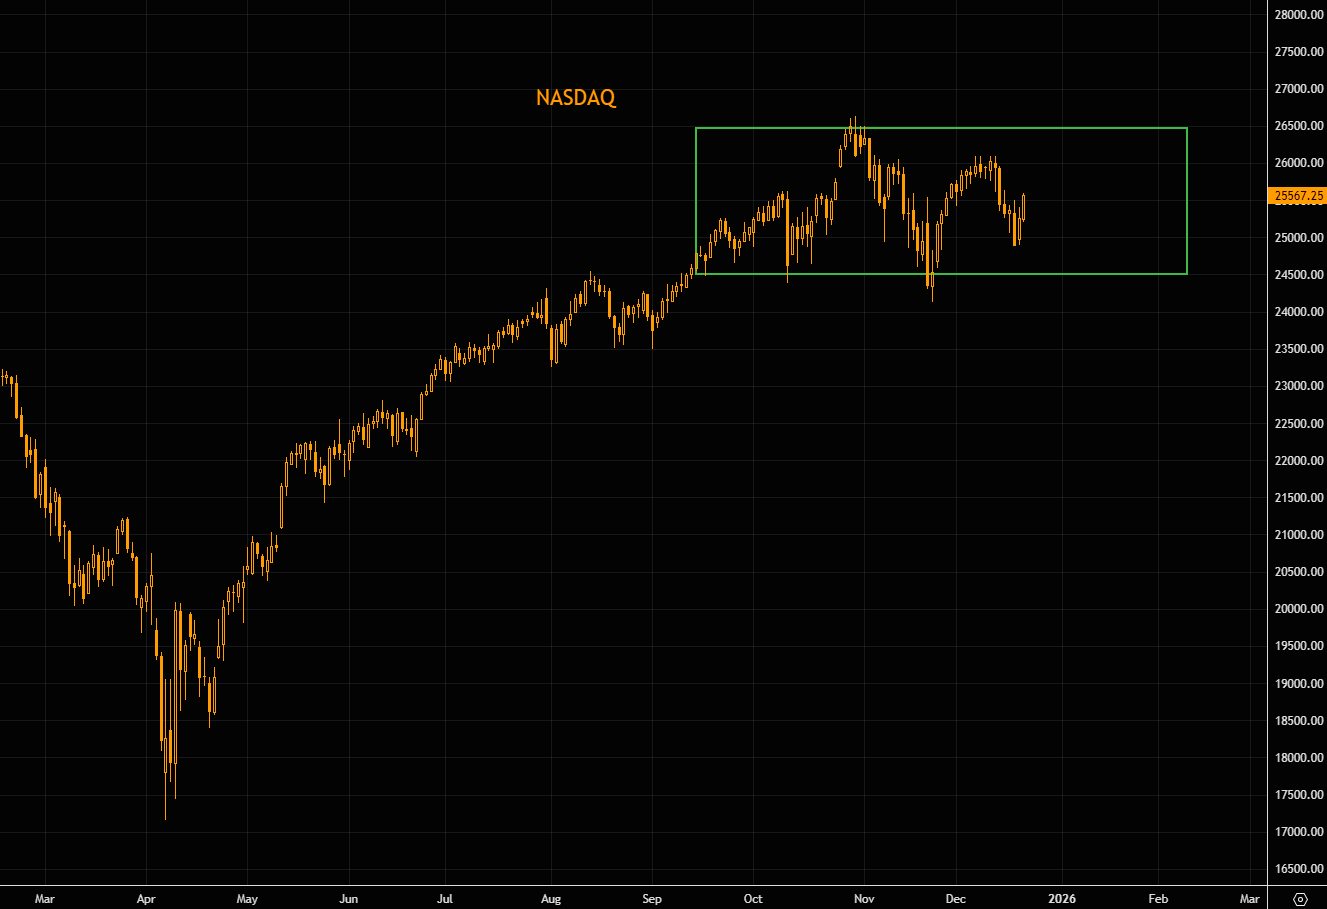
Source: LSEG Workspace
Why not at least at ATH?
SPX has hugged bond volatility all year. The inverted MOVE is screaming ATHs... equities just haven’t caught up yet. More on the latest bond volatility crash here.
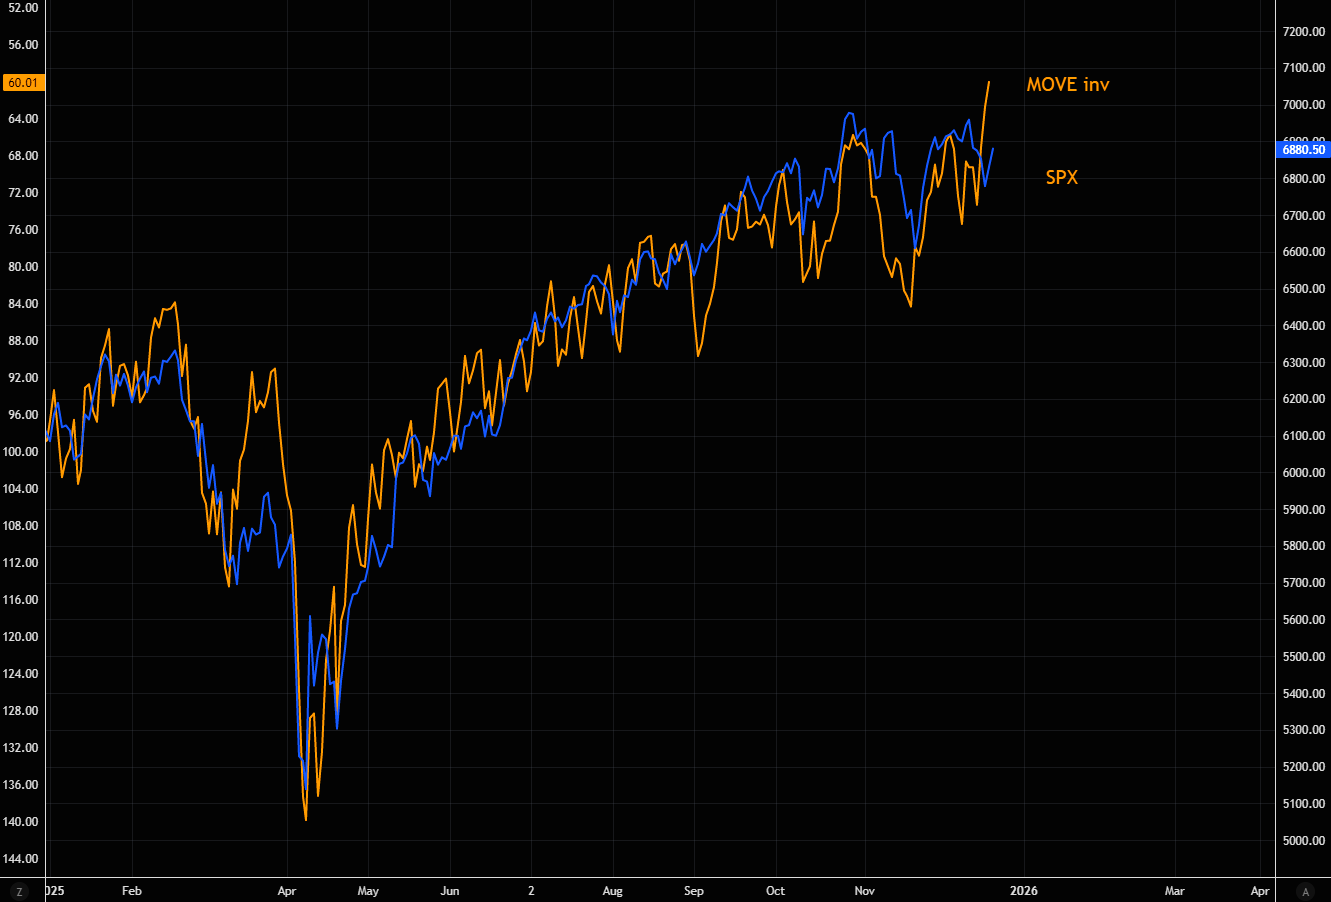
Source: LSEG Workspace
You know the squeeze is on...
...when even ORCL starts reversing.
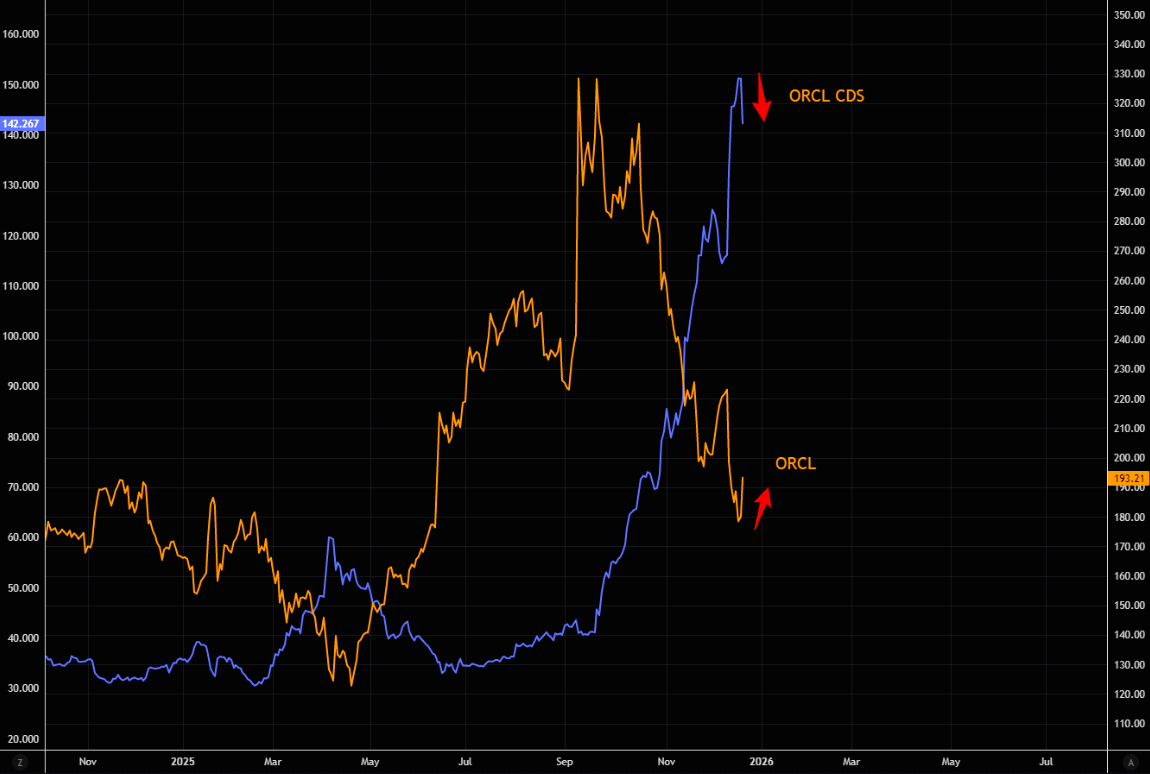
Source: LSEG Workspace
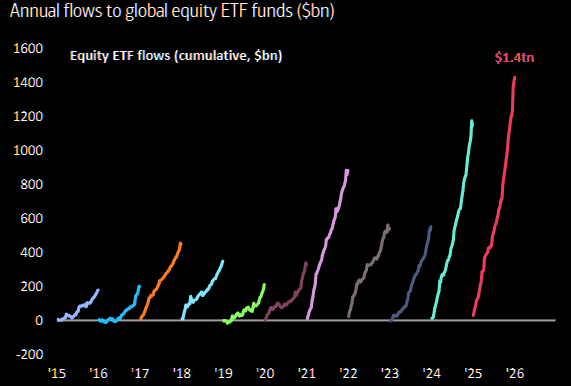
ETF mania
Inflows to equity ETFs setting another record... and needs a bigger chart soon.
Source: BofA
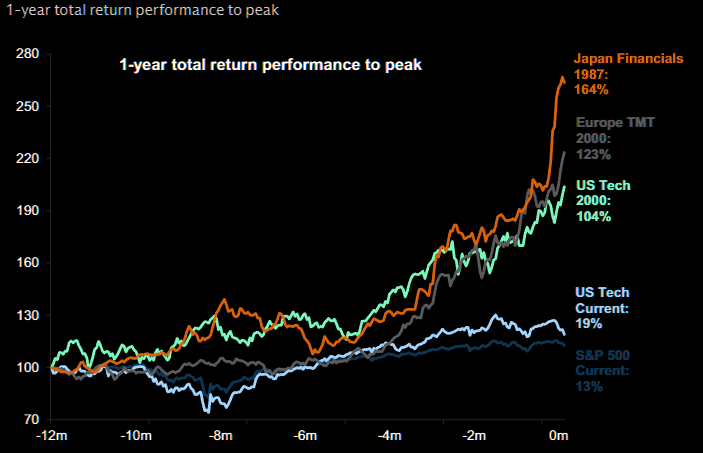
Almost an anti bubble
Lot of bubble talk lately, but this looks very modest comparing to past bubbles.
Source: GS
Be bullish
BofA remains constructive on chip stocks into 2026. AI capex is mission-critical for Big Tech, driving returns via more efficient GPU/custom infrastructure, protecting core moats, and supporting early-stage enterprise and sovereign AI adoption. Despite volatility, AI should continue to deliver attractive returns across cloud, memory, optical, and semicap stocks.
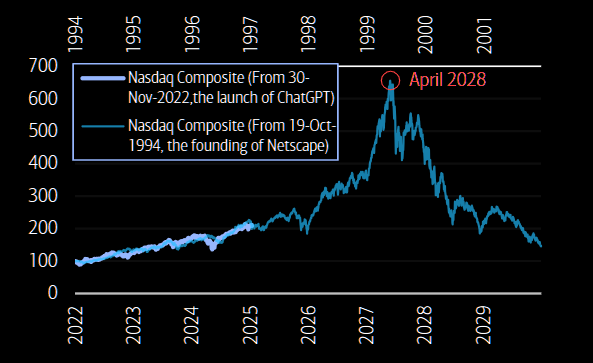
Imagine we follow the Netscape path...
Source: BofA
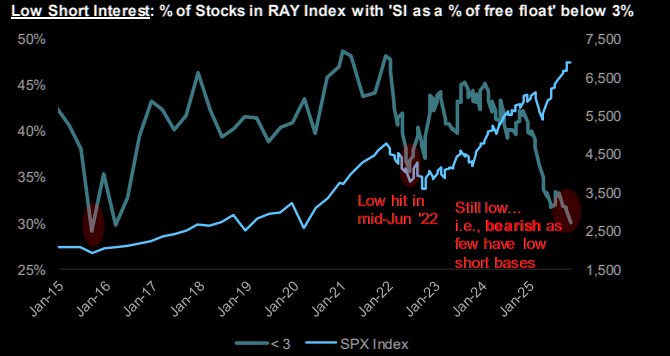
Need to be carried out first
Related to HF leverage, one sign conditions are less frothy than feared is that short positioning remains healthy. In past rollovers (early-2025, 1H22, 2015), shorts increased as markets weakened and the share of stocks with very low short interest fell. So far, shorts have not been meaningfully reduced. Latest on positioning here.
Source: JPM
Before you get too bullish...
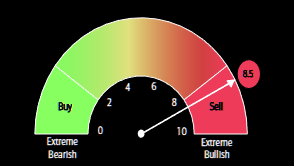
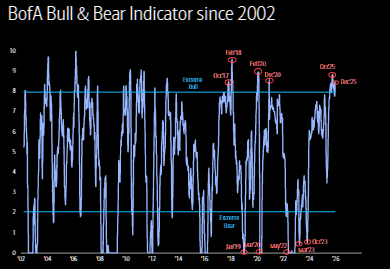
Sell signal triggered
BofA's contrarian sell signal just got triggered. Since 2002, 16 sell signals have been followed by a median 2.7% decline in global stocks over two months, with a 63% hit rate. Max drawdowns typically reach ~4% after one month, ~6% after two months, and ~9% after three months, while upside foregone stays below 2%.
Source: BofA
Source: BofA
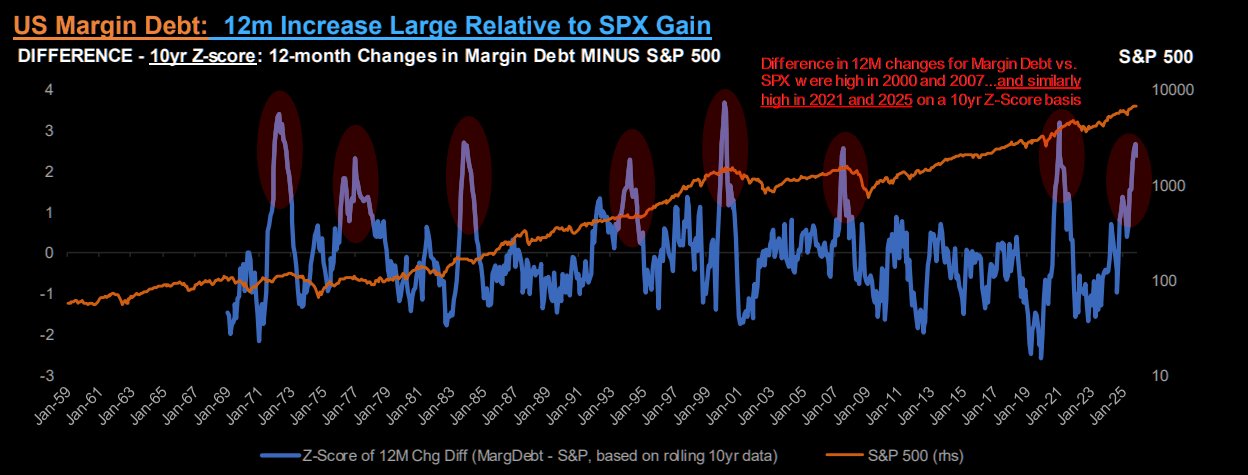
Flashing like the 2000 and 2007 peaks
The 12-month margin debt vs. SPX relationship has weakened in absolute terms. Adjusting for the 10-year rolling trend, the current divergence (similar to 2021) is now comparable to the extremes seen near the 2000 and 2007 peaks.
Source: JPM
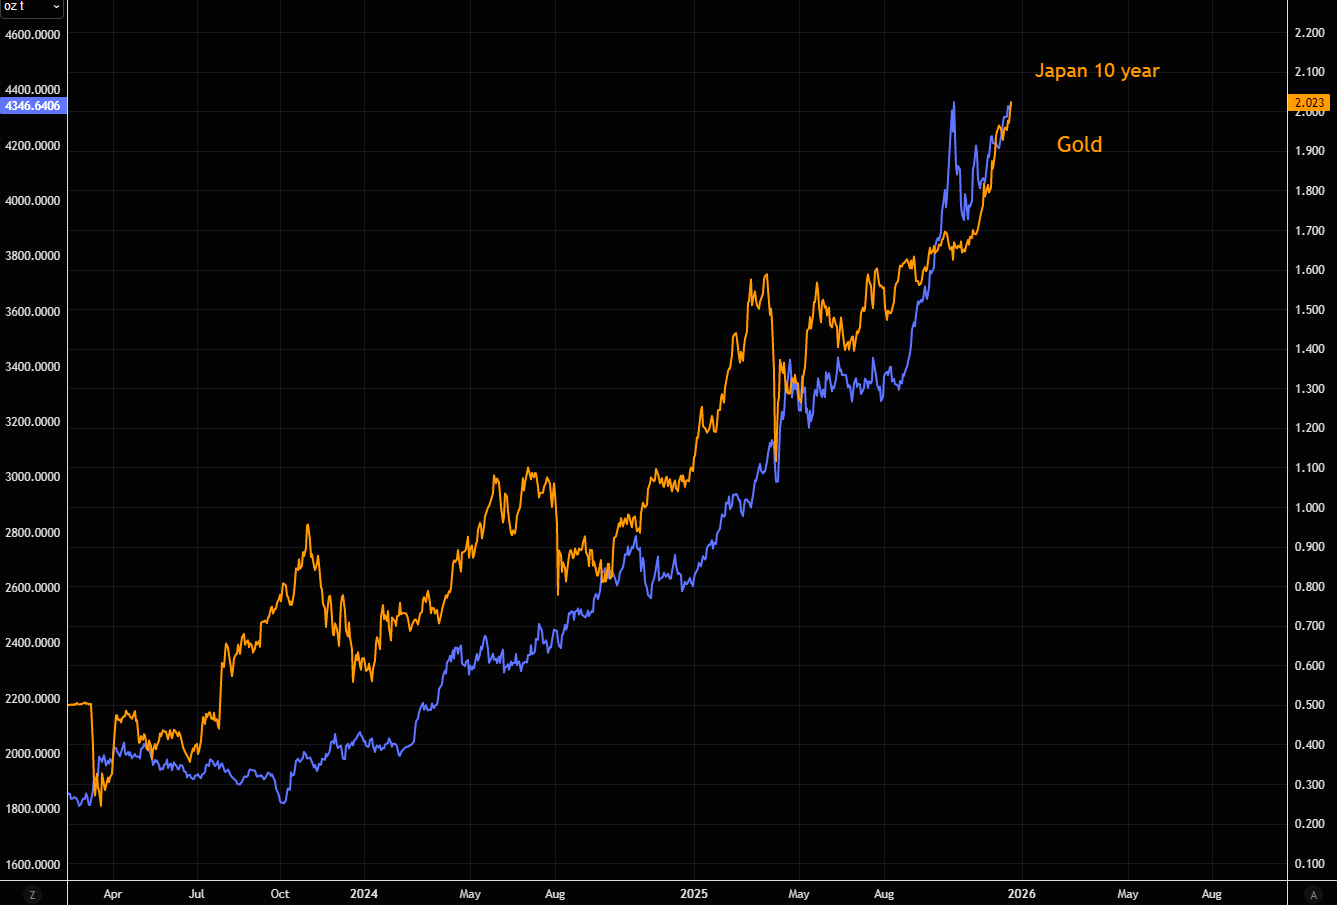
Yes, gold gets it
Gold and the Japanese 10 year continue moving in perfect tandem. The ultimate everything hedge knows what's going on...