What If That Second Wave of Inflation Is Upon Us?
2% target - 3% reality
After easing from its peak, U.S. inflation has remained stuck near 3% for more than two years. Recent moves in breakevens, commodities, and growth-sensitive sectors suggest inflation risks may be drifting higher again, even as markets continue to price stability rather than stress.
Is inflation risk creeping back in?
Chart shows Linkers vs. bonds and inflation sectors.
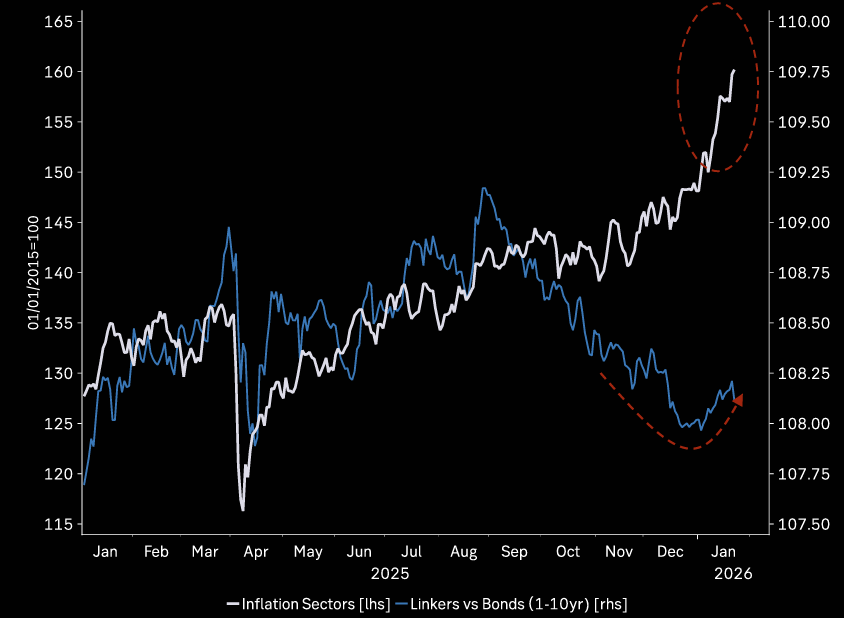
Source: Macrobond
2nd wave
She moves in mysterious ways / waves. Hartnett says 2nd wave of inflation future possibility. This chart for sure is something special...
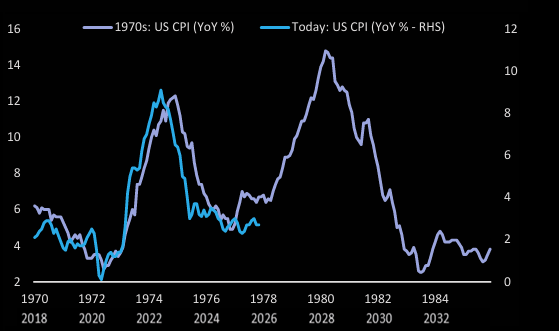
Source: BofA
Perhaps understandable
Perhaps it is understandable that FOMC members remain worried about inflation.
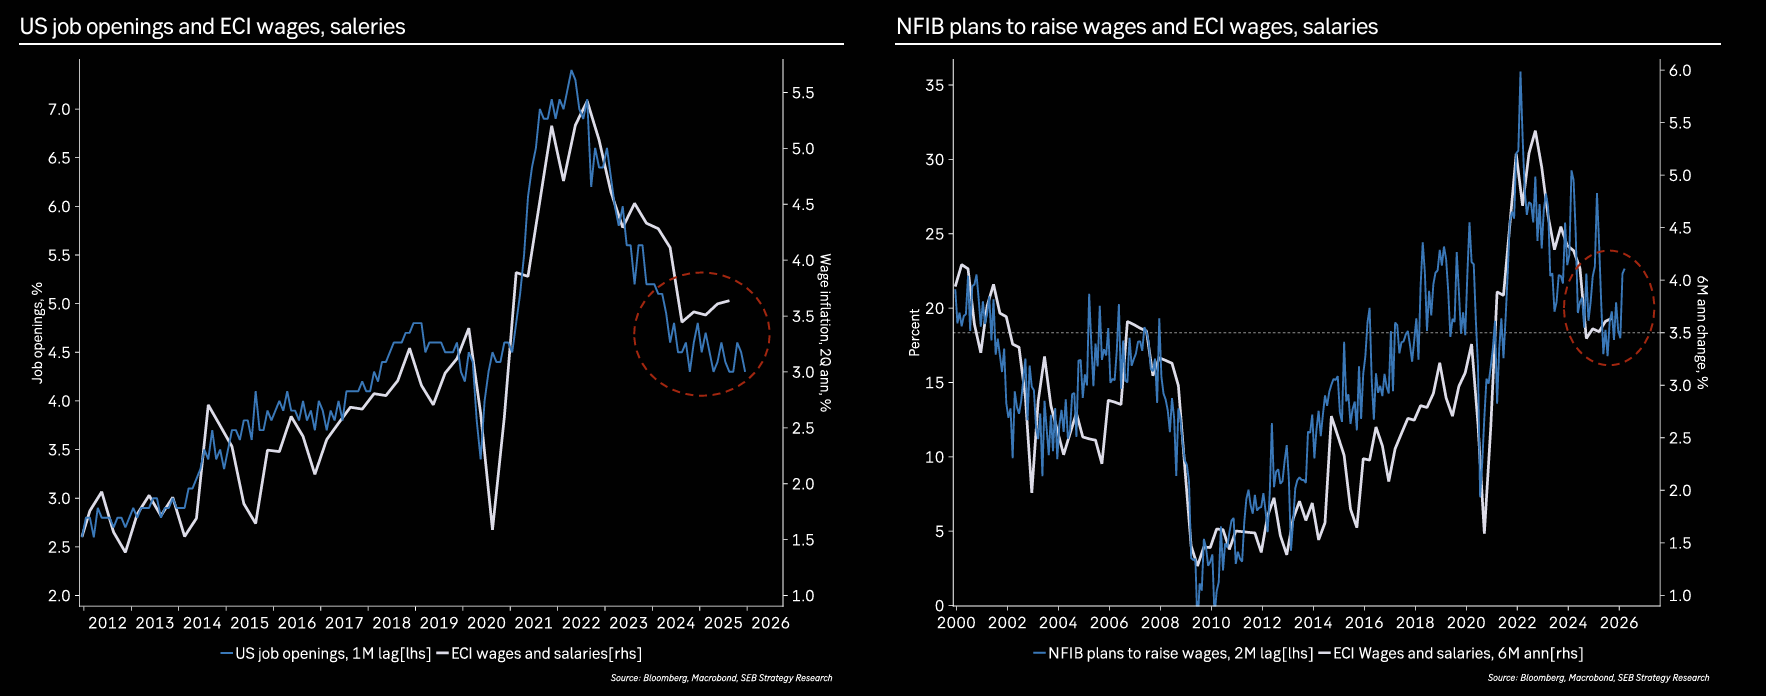
Source: Macrobond
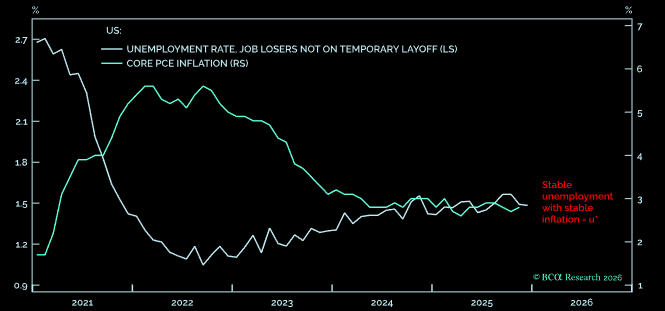
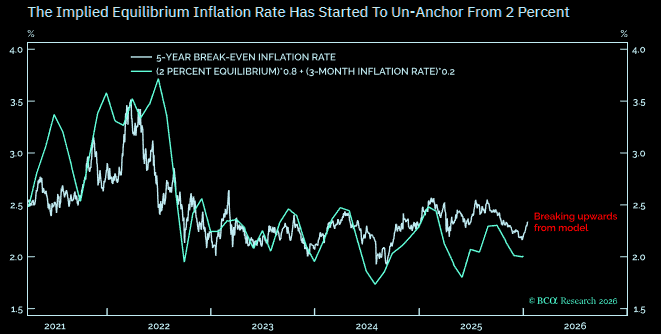
3%
US inflation has hovered around 3% for more than two years, while long-term inflation break-evens remain near 2%. The longer inflation stays stuck at 3%, the greater the risk that expectations reset higher writes Dhaval Joshi. With both inflation and unemployment stable, the economy appears to be operating at a new u-star, and the kicker is that this equilibrium implies inflation closer to 3%, not 2%.
Source: BCA
Source: LSEG Workspace
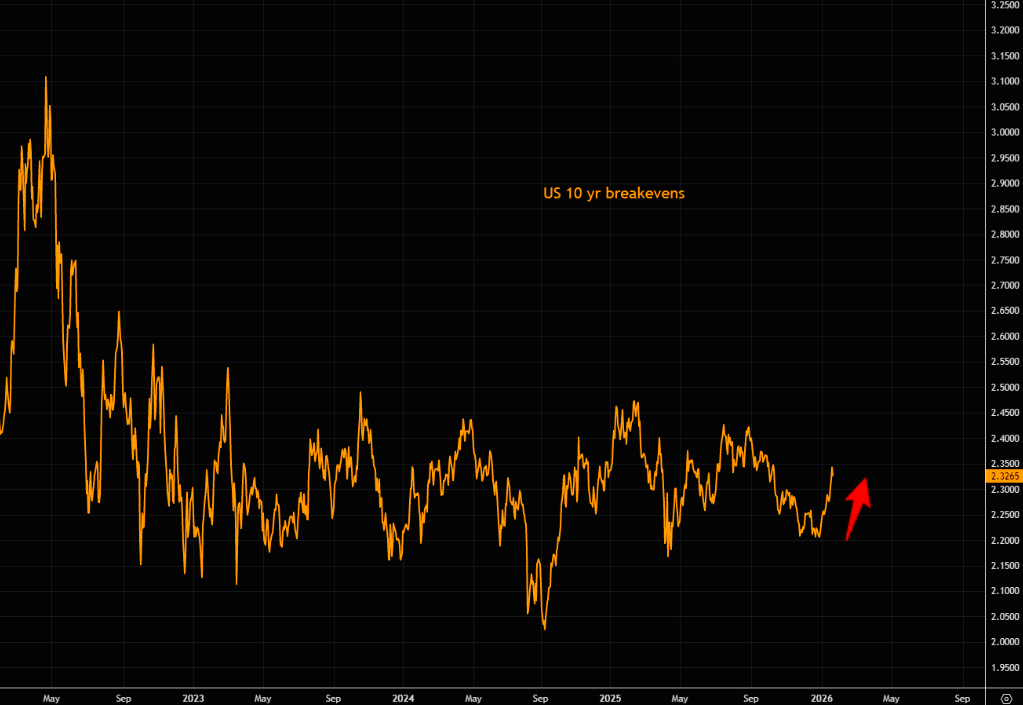
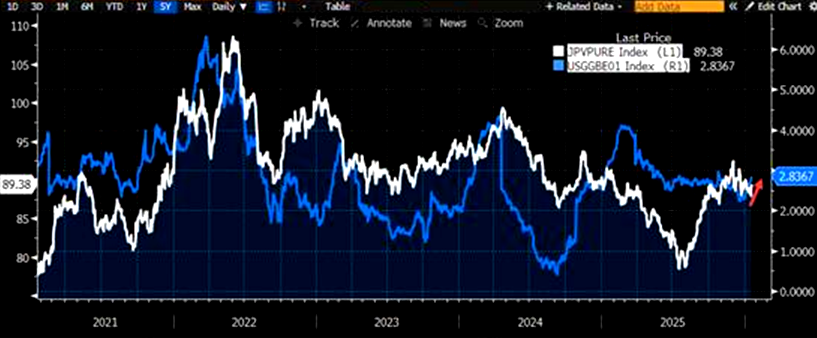
Breakevens
US 10 year breakevens moving higher lately...
Source: LSEG Workspace
Tariff pass-through
Is there more pass-through from tariffs coming?
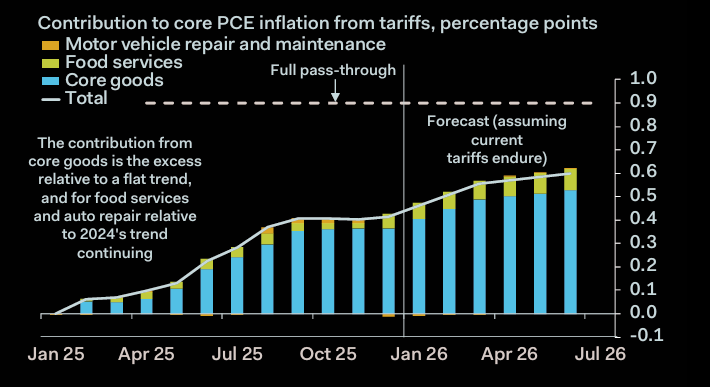
Source: Pantheon
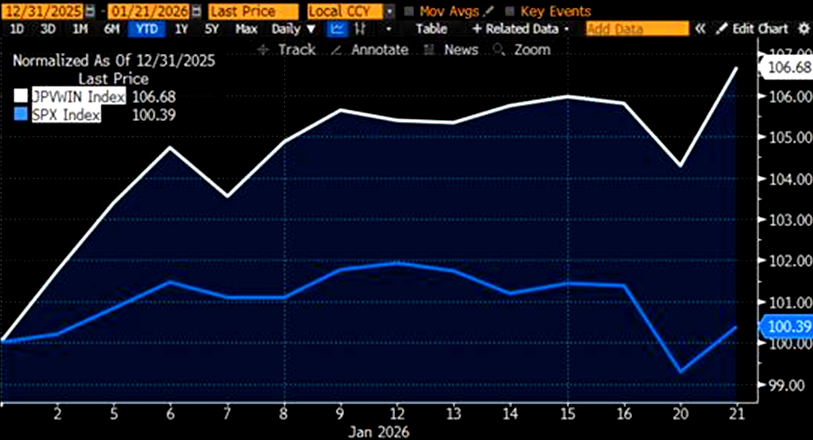
Accelerating economic growth
Accelerating economic growth and a strong labor market, combined with policy uncertainty around tariffs, point to a potential rise in inflation. One-year breakeven inflation is up 60 bps YTD and could break out further with upcoming inflationary data.
JPM trading desk: "To capture or hedge against this inflation risk, favor long positions in Value (JPVPURE) or Value Winners (JPVWIN), which have outperformed the SPX by 6% YTD. o Key sector beneficiaries of rising inflation include Homebuilding, Regional Banks and Autos."
Source: JPM
Source: JPM
100%
"I read recently that US CPI has risen by 93% since January of 2000, which struck me. if you’re curious when that should reach an even 100%, circle your calendar for October of next year." (Tony P)
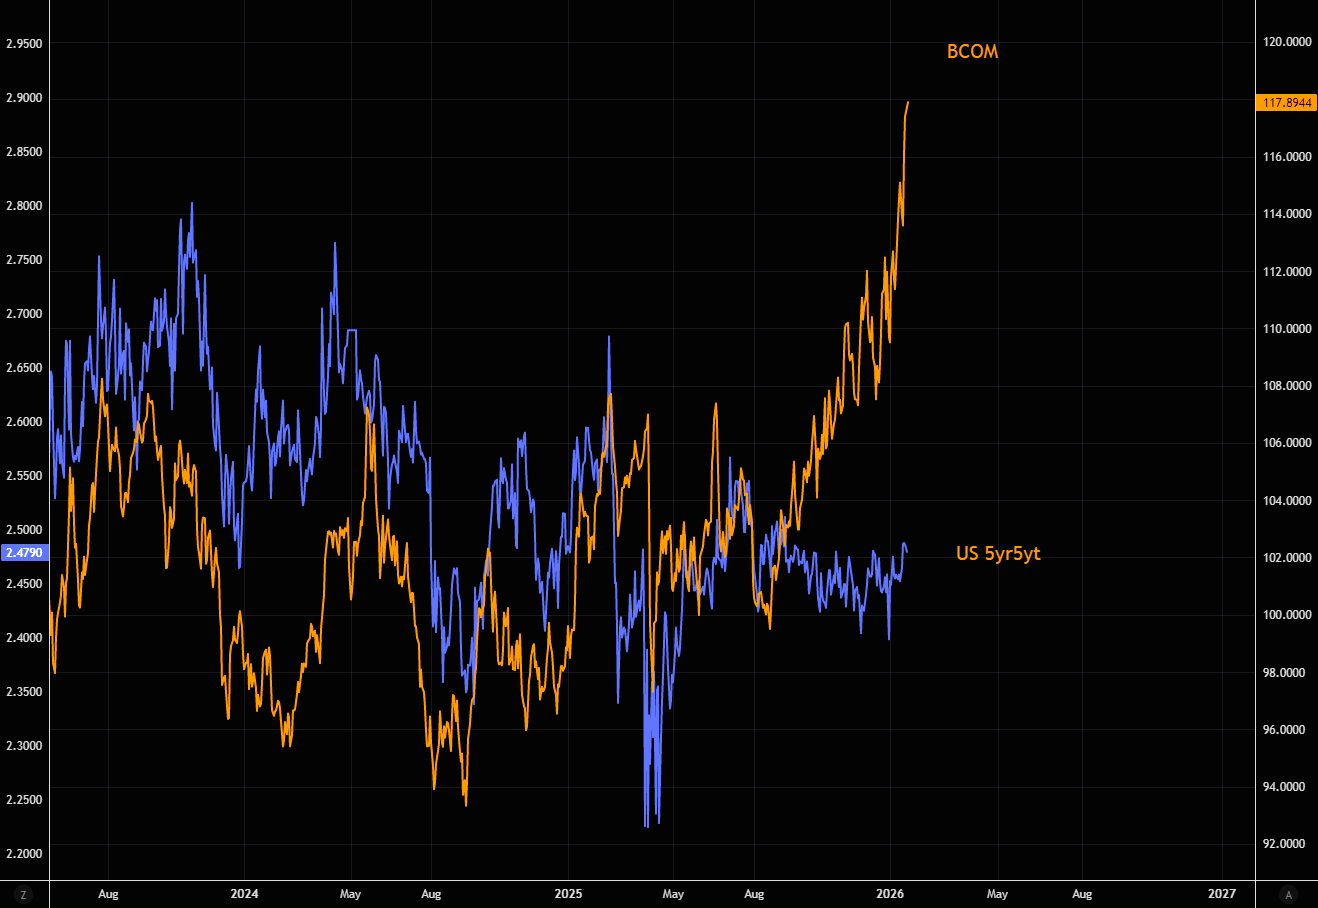
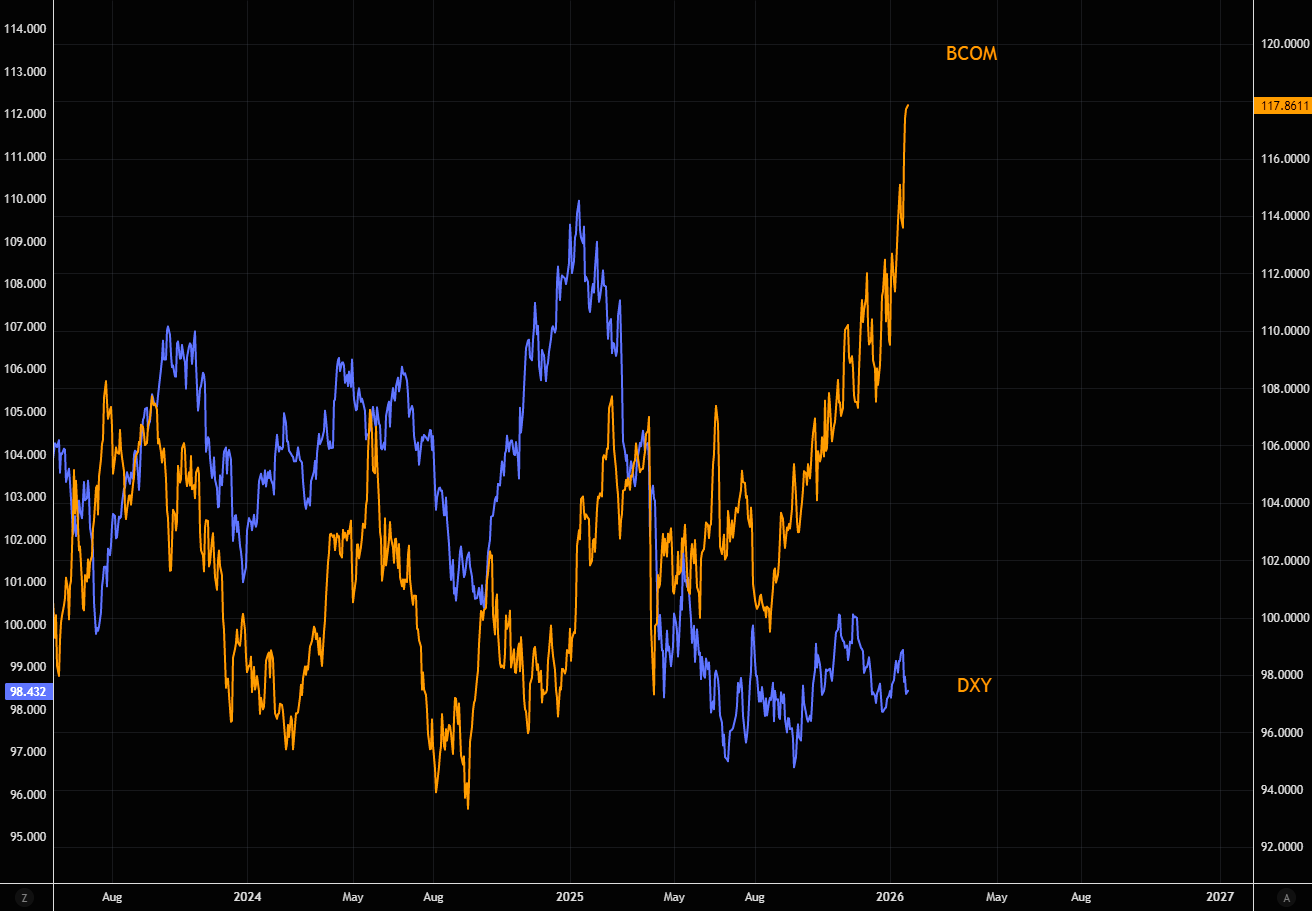
BCOM
The surge in BCOM is starting to raise the question of whether we’re in the early stages of reflation. As Goldman’s Privorotsky noted a few weeks ago, moves like this tend to signal either a broad dollar devaluation or a rapid re-acceleration in global growth. Chart 1 shows BCOM vs. US 5y5y inflation expectations, while Chart 2 compares BCOM to the DXY. The dollar has gone essentially nowhere since April, even as commodities have surged.
Source: LSEG Workspace
Source: LSEG Workspace
Retirees need inflation protection + income
Chart shows household net worth ($tn; 1989-2Q25).
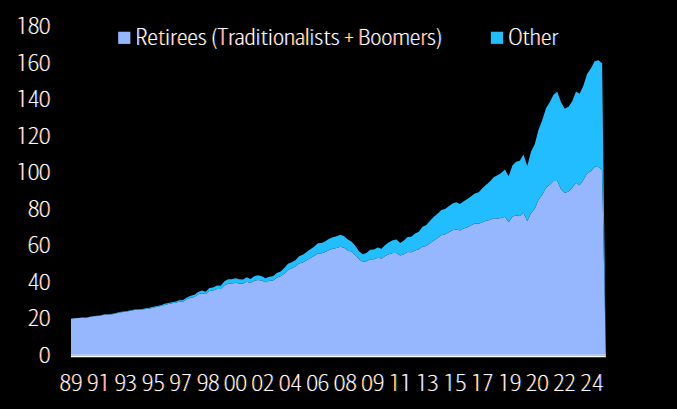
Source: BofA Quant
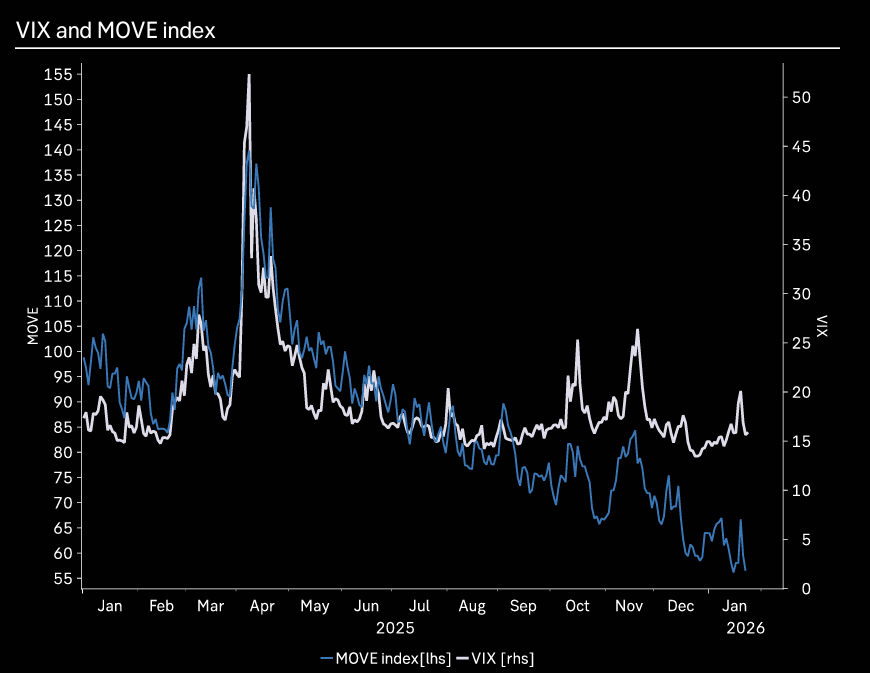
If bond markets have a problem...
…why is it not showing up in implied volatility indices like MOVE?