What A Week!
Stressed into the weekend
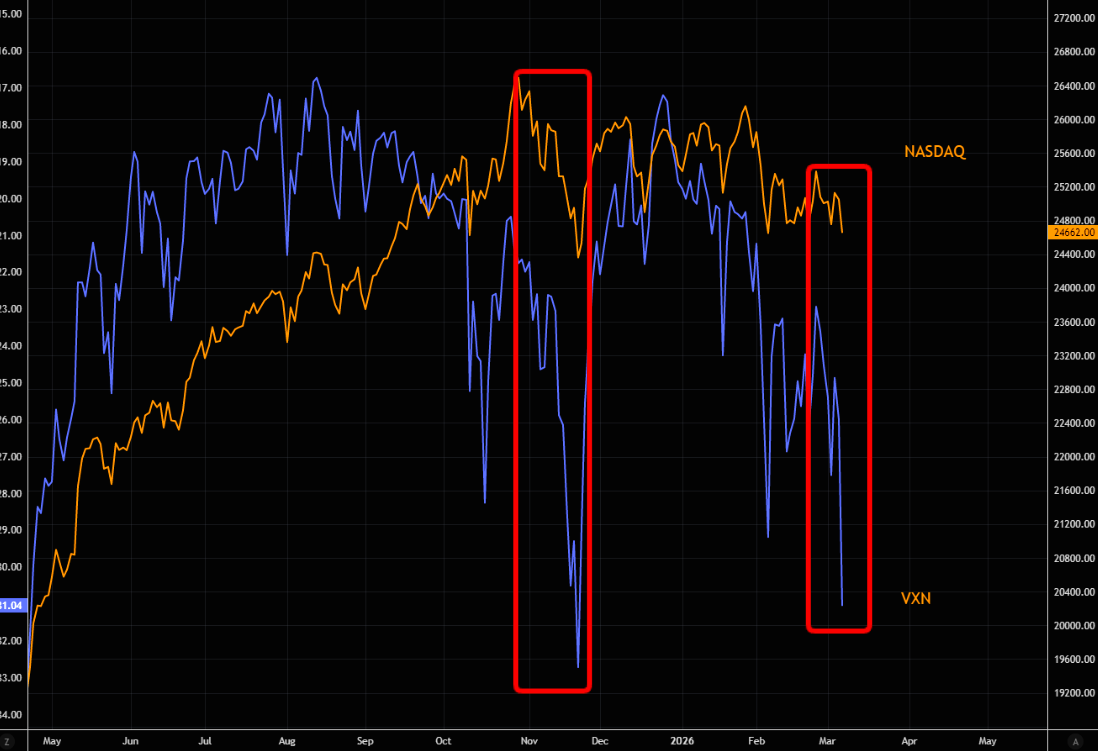
VXN is massively stressed heading into the weekend. The explosion in VXN late last year was accompanied by a sharp sell-off in the NDX. This time around volatility is in panic mode, yet the index has moved very little. The chart shows NDX vs. VXN (inverted). More on the surge in global fear here.
Source: LSEG Workspace
King of fear
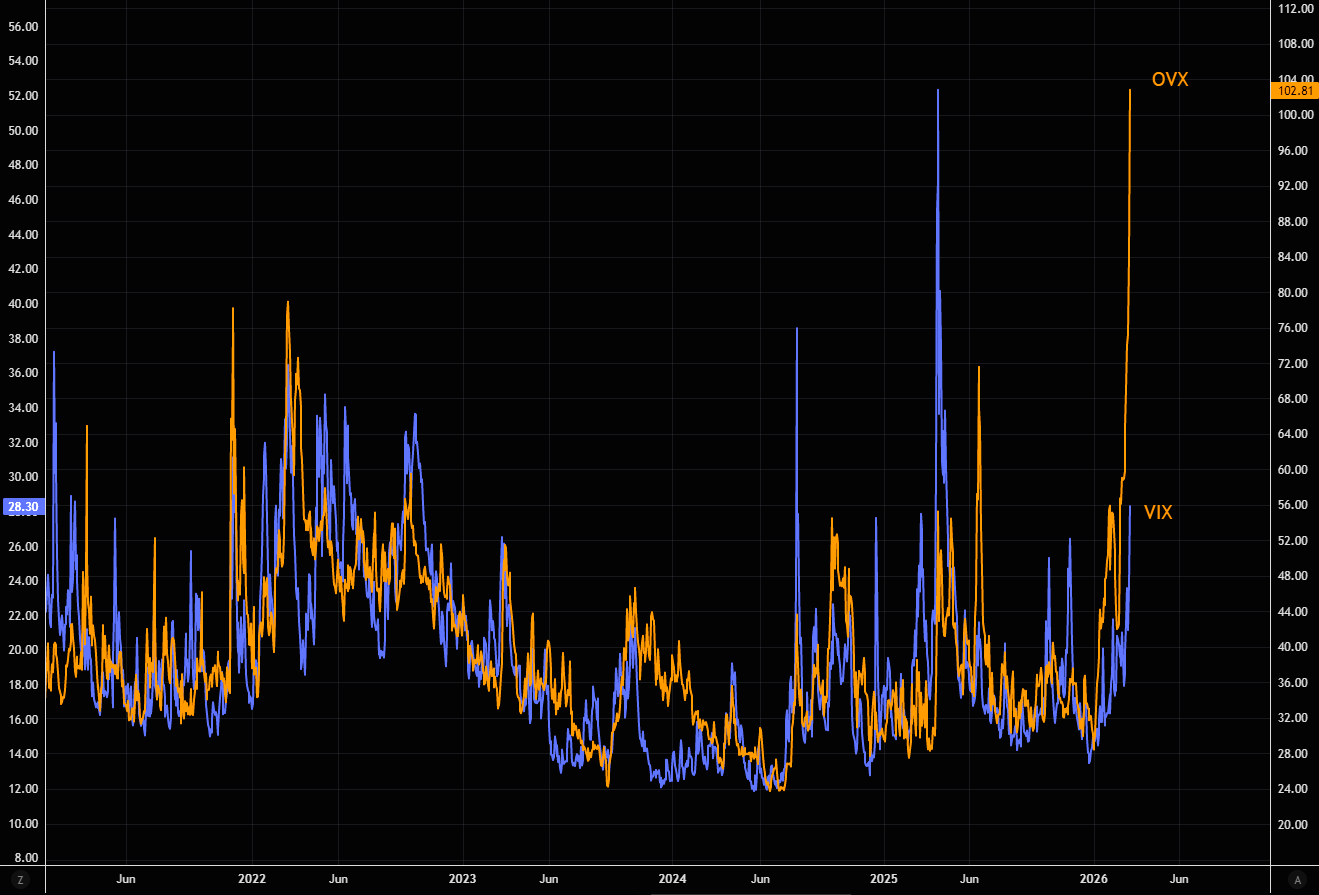
Oil volatility is ending the week on a high note, with the OVX at 103. You know things are seriously stressed when the VIX explosion looks tiny in comparison.
JPM’s Natasha Kaneva sums up the short-term oil setup well: “Prices may decline by $10 on reassuring headlines, but they could rise by $30 once Gulf production shut-ins begin to materialize and ripple through the market.” Go price that option...
Source: LSEG Workspace
Must hold
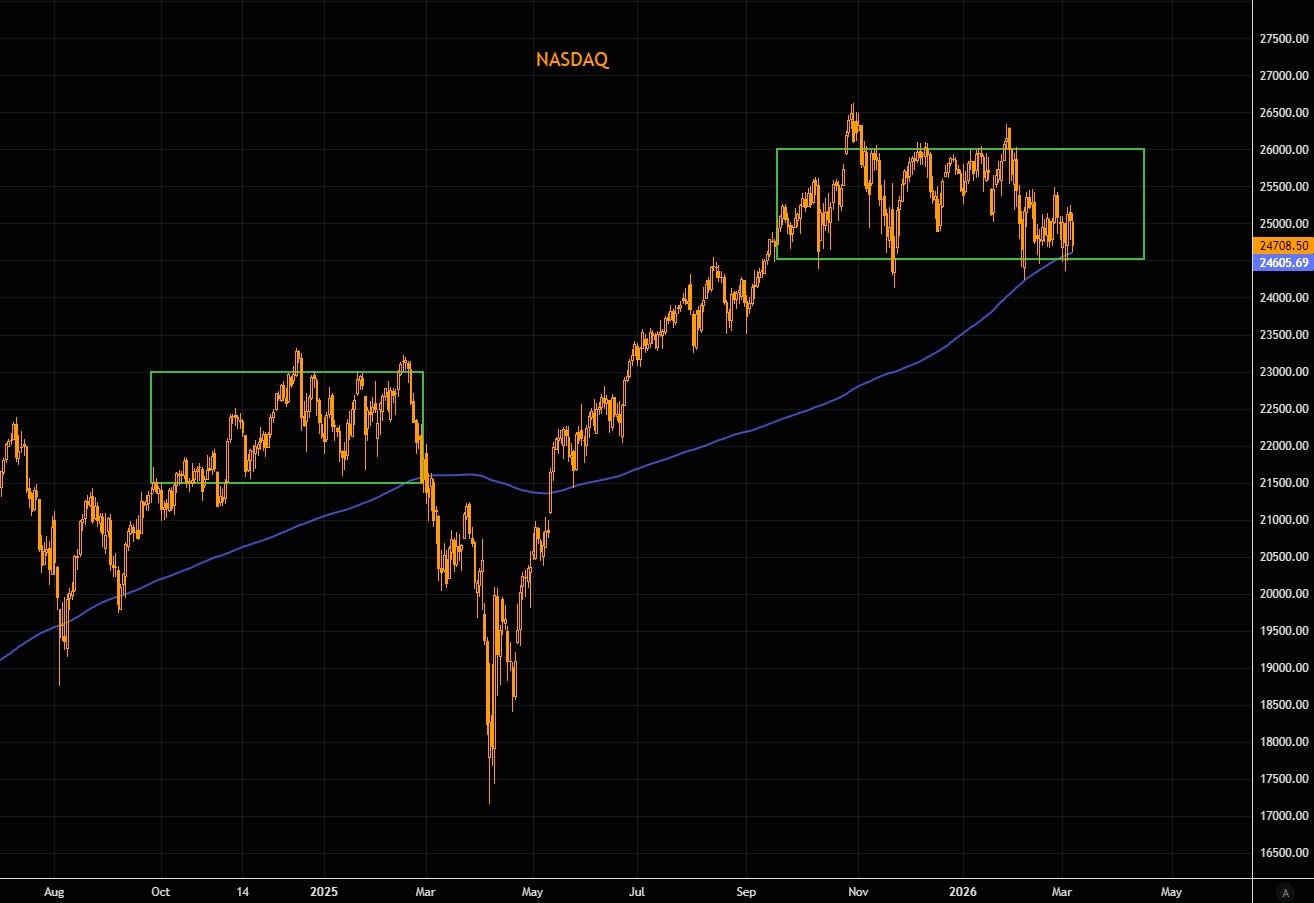
The NASDAQ is approaching a key make-or-break support area. The 200-day moving average and the lower end of the range sit slightly below current levels. Let’s see how this plays out, but our déjà vu scenario still looks possible. A close below 24,500 (futures) could set up a similar situation to what we saw almost exactly a year ago.
Source: LSEG Workspace
On corrections
Hartnett on how/when corrections end. Corrections triggered by exogenous shocks during periods of excessive bullishness typically end once:
1. Oversold trough forms – software, MAGs, private credit, bank loans, bitcoin.
2. Overbought leaders roll over – gold, semis, metals, EM, Europe, banks (Feb ’26 Global FMS).
3. Safe havens lose bid – oil, US dollar.
Where we are? Price action suggests 1 & 2 may be starting. Oil & dollar still need to give the all-clear.
Limited upside for now:
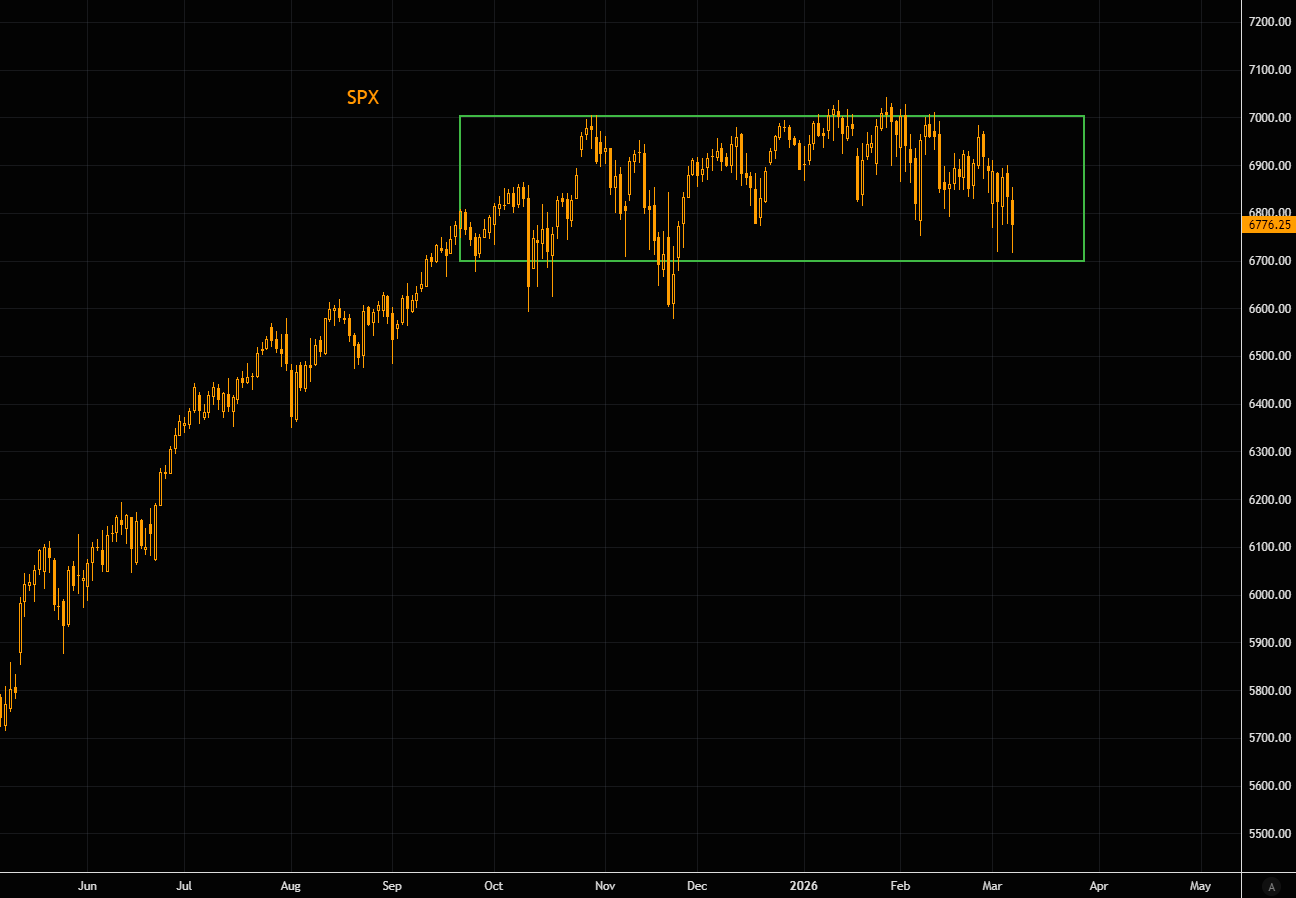
• No proper price flush (e.g. SPX < 6600).
• Positioning still very bullish.
• No policy panic (bar Korea).
Source: LSEG Workspace
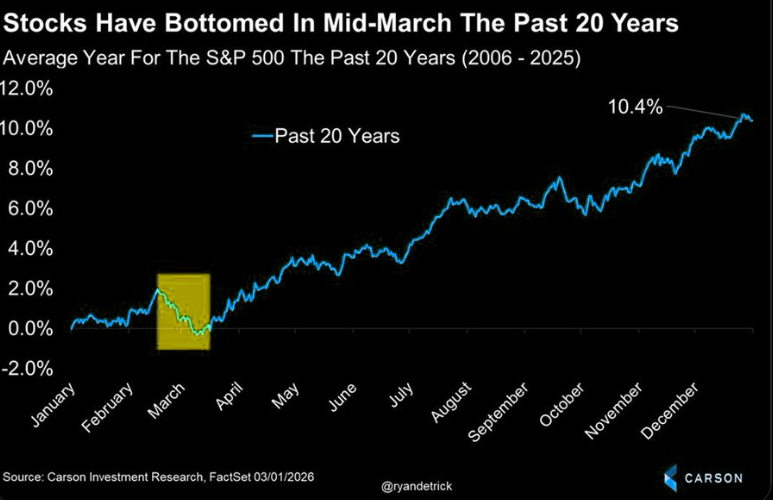
Stock bottom mid-March
"It is what it is, weakness in February and the early parts of March are quite common the past two decades."
Source: Carson
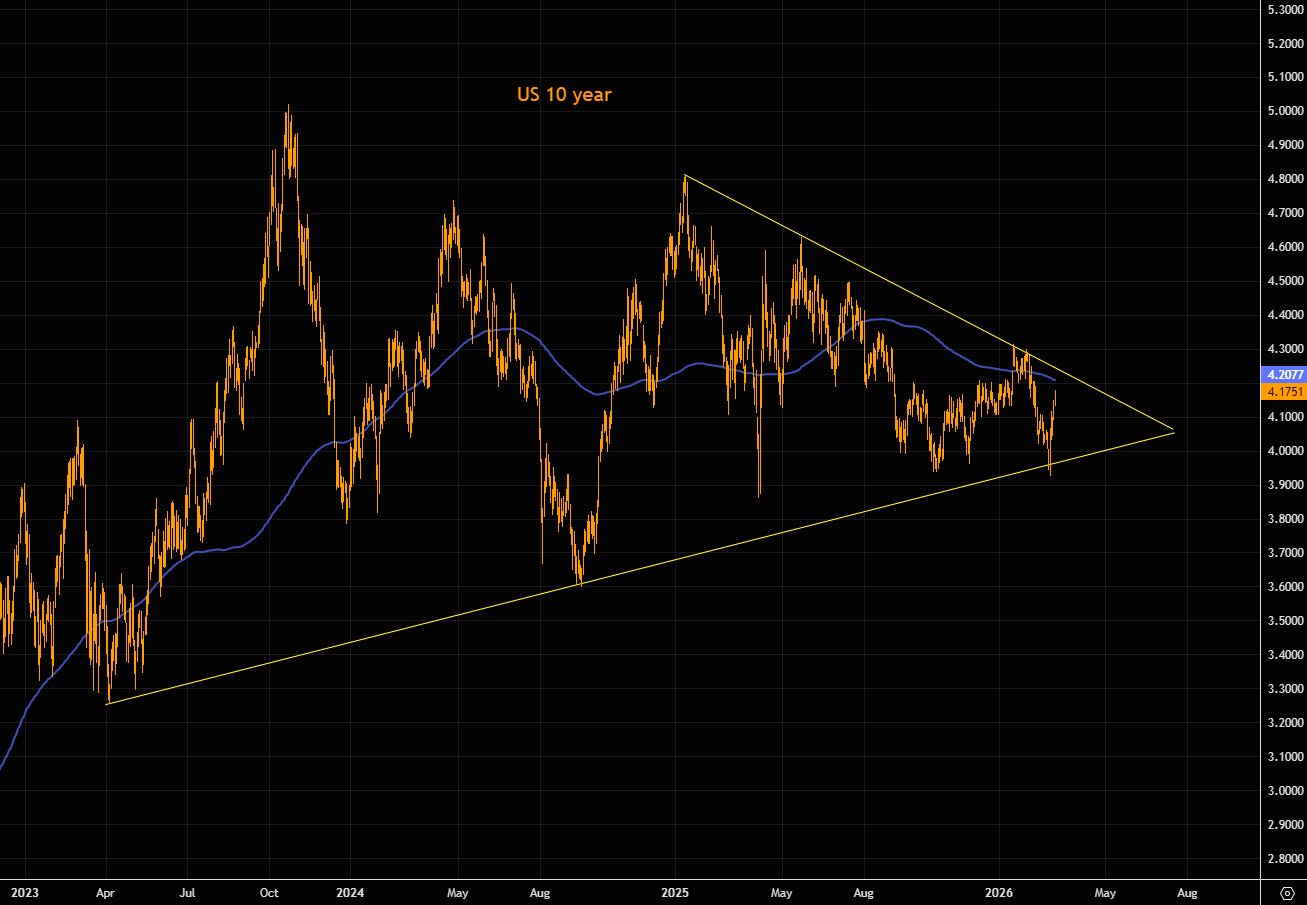
Still stuck
The US 10-year remains stuck inside a large wedge-like formation. 4.2% is the key resistance level to watch, which also coincides with the 200-day moving average. Psychology inside the wedge is becoming increasingly tricky. More on rates here.
Source: LSEG Workspace
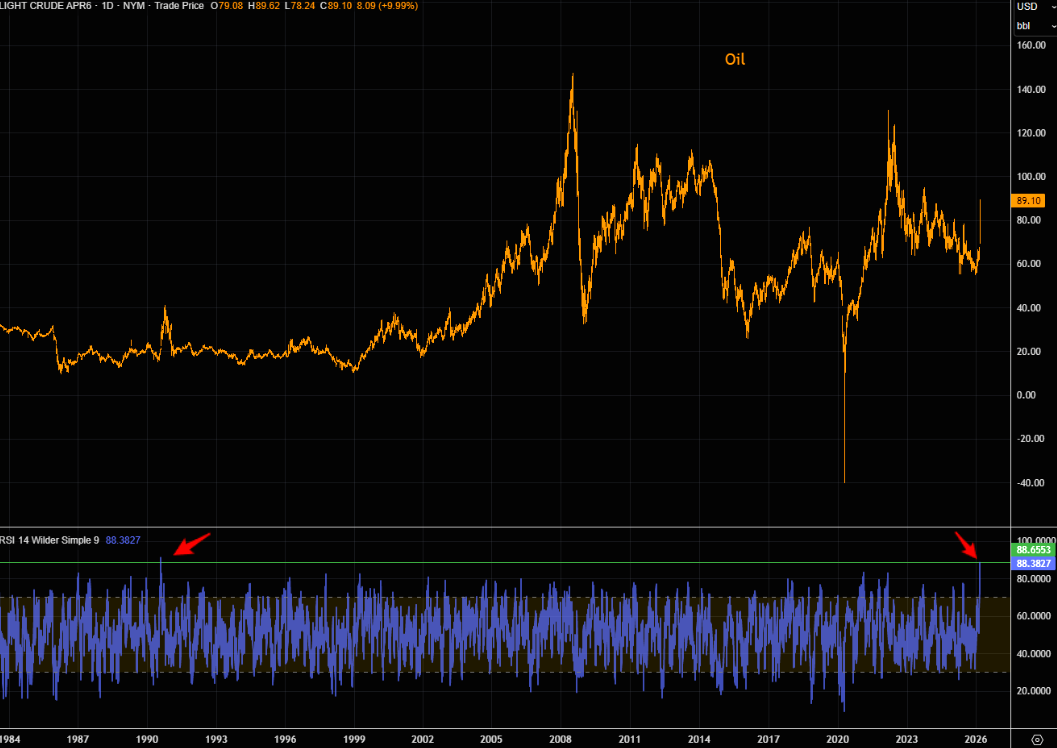
Rude crude
Oil is at its most overbought levels since the Kuwait War, with the daily RSI above 88! More on oil here.
Source: LSEG Workspace
Gold is stuck
Gold continues to trade within the range established after the late-January sell-off. We have seen several up- and down-moves, but prices remain largely unchanged around the midpoint of that large down candle. Our view remains the same: gold likely needs a longer consolidation period. The 50-day moving average and the longer-term trend line sit lower.
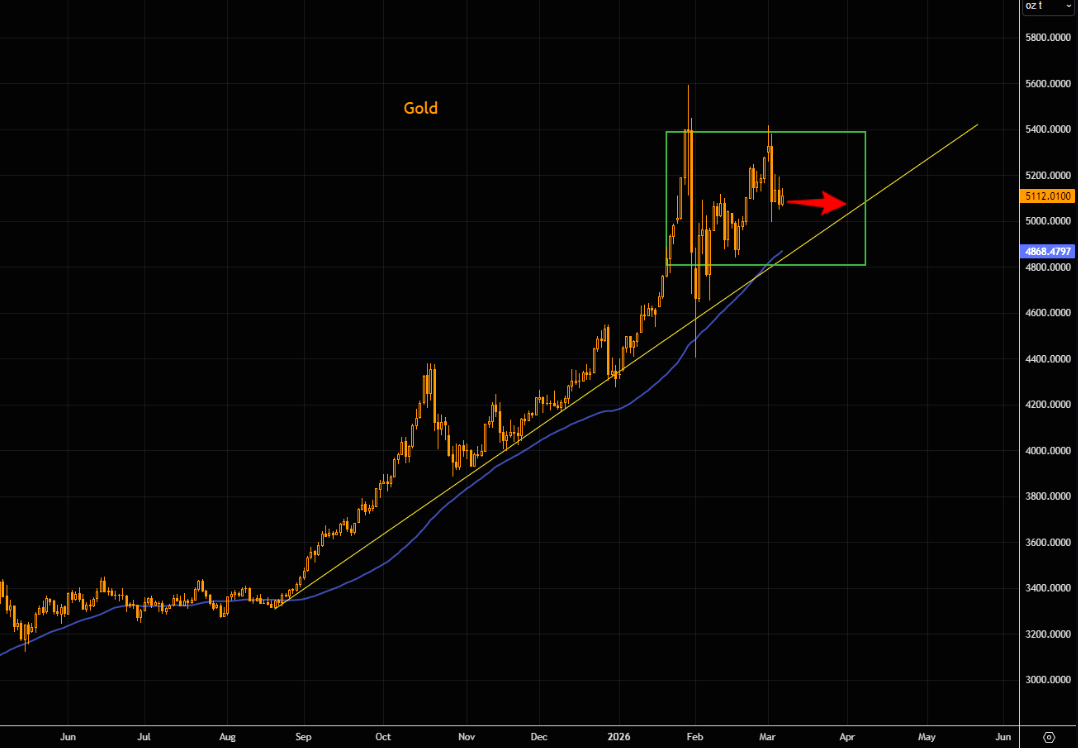
Source: LSEG Workspace
Inflows
Last week the GLD showed the biggest inflow YTD. Bullish flows, but uninspiring price action. You decide. More on gold here.
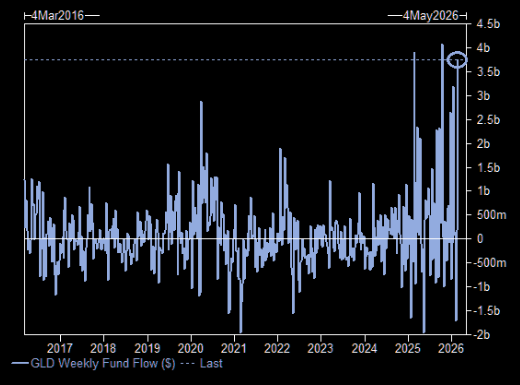
Source: GS
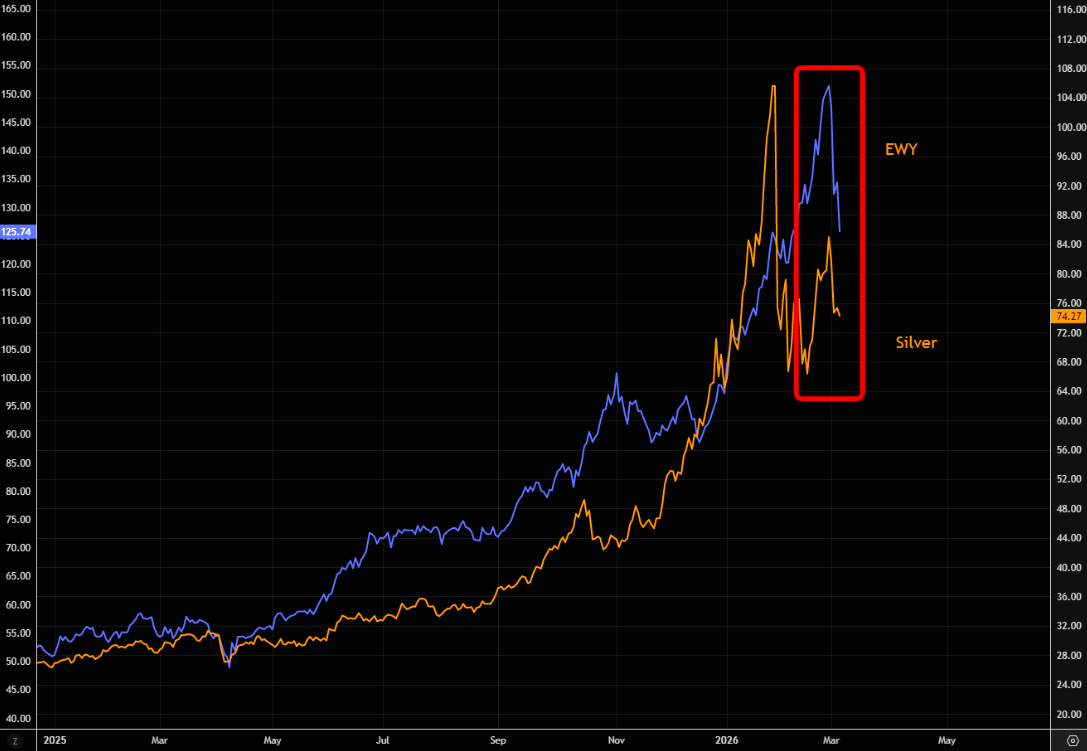
Size speculation
Despite all the silver narratives, the main driver behind the recent moves has been speculation on steroids. Interest in silver has faded lately, but overlay the chart with Korea and the two move almost in tandem. In our view, Korea remains one of the most speculatively driven markets at the moment. Latest note on silver here.