The Wrap: SPX Stuck, BTC Cracks, Silver Screams, and Japan’s Bondquake Spreads
Perfectly stuck
SPX trading inside the range that has been in place since around mid September. We bounced on the 100 day (range lows) and are trading above the 50 day, but we aren't getting excited, either way, until we see a proper break out move.
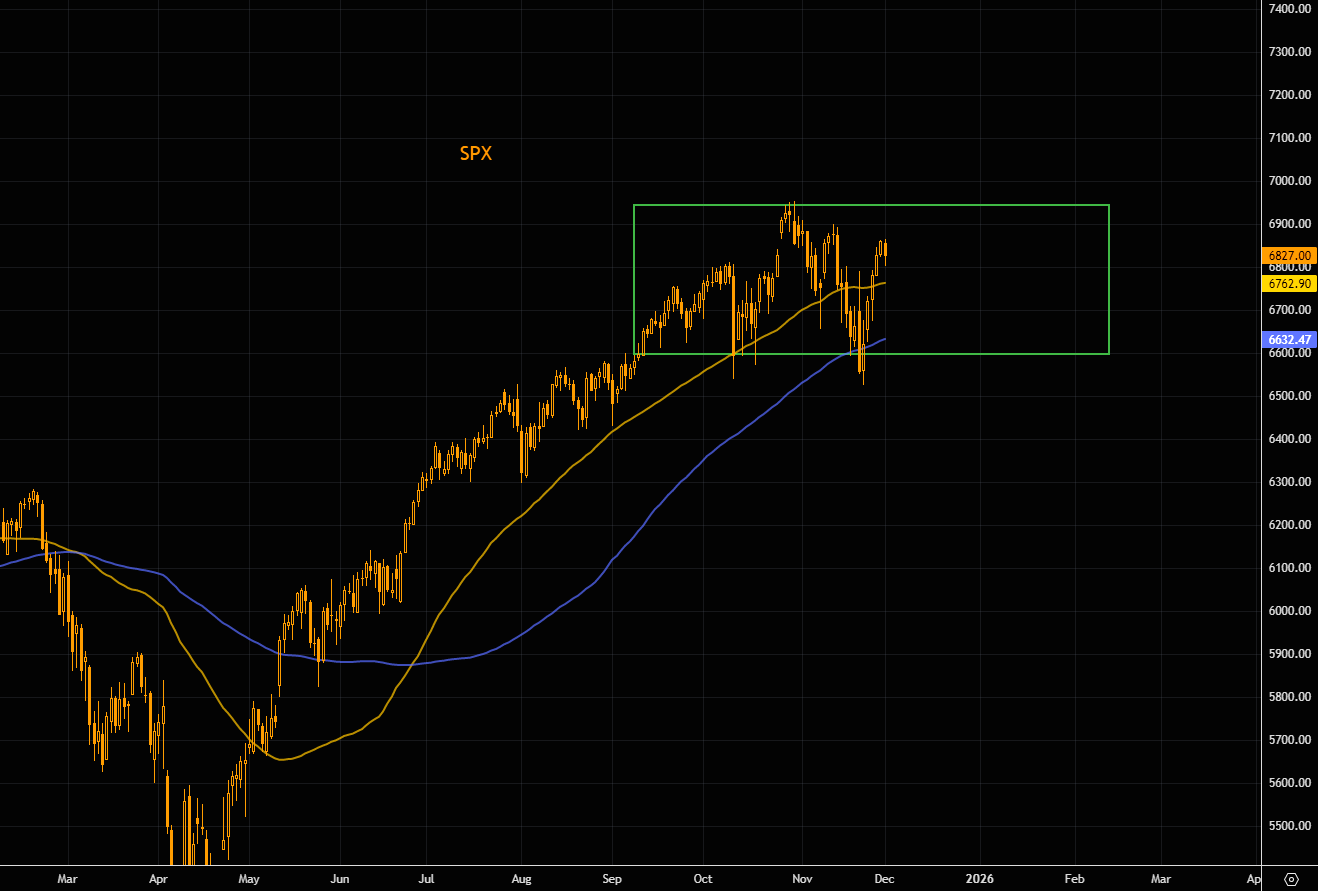
Source: LSEG Workspace
Can always move lower
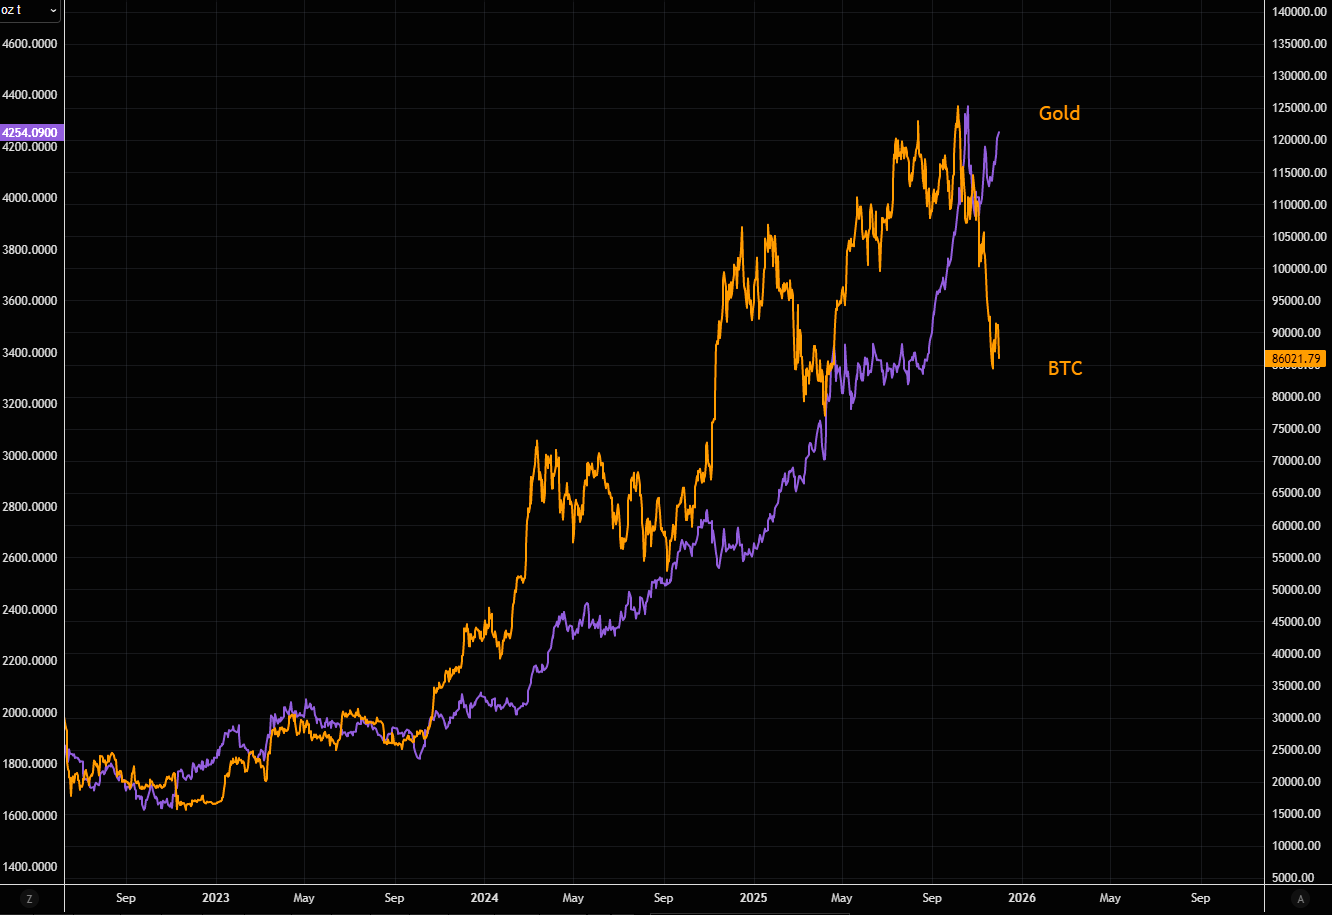
This looks uncomfortably similar to the 2021–2022 BTC pattern, a wide range, a soft double top, and then the air pocket. Once that range gave way back then, BTC dropped 50% and even knifed through the 200-week MA. Today that 200-week is near 56k. Chart two shows we’ve already cracked the big trend line. Full BTC note here.
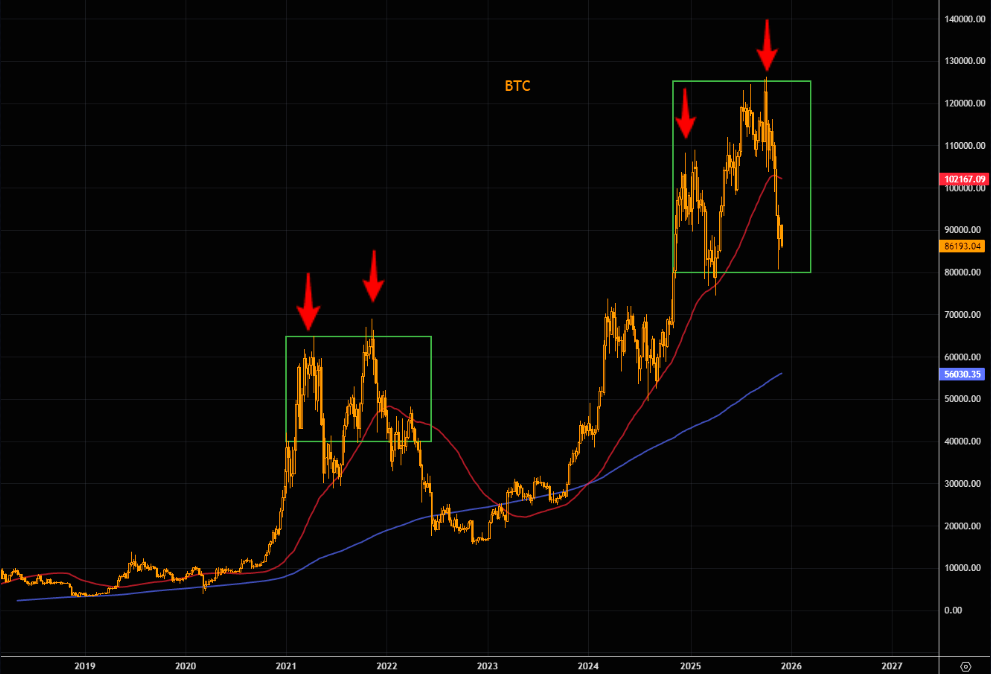
Source: LSEG Workspace
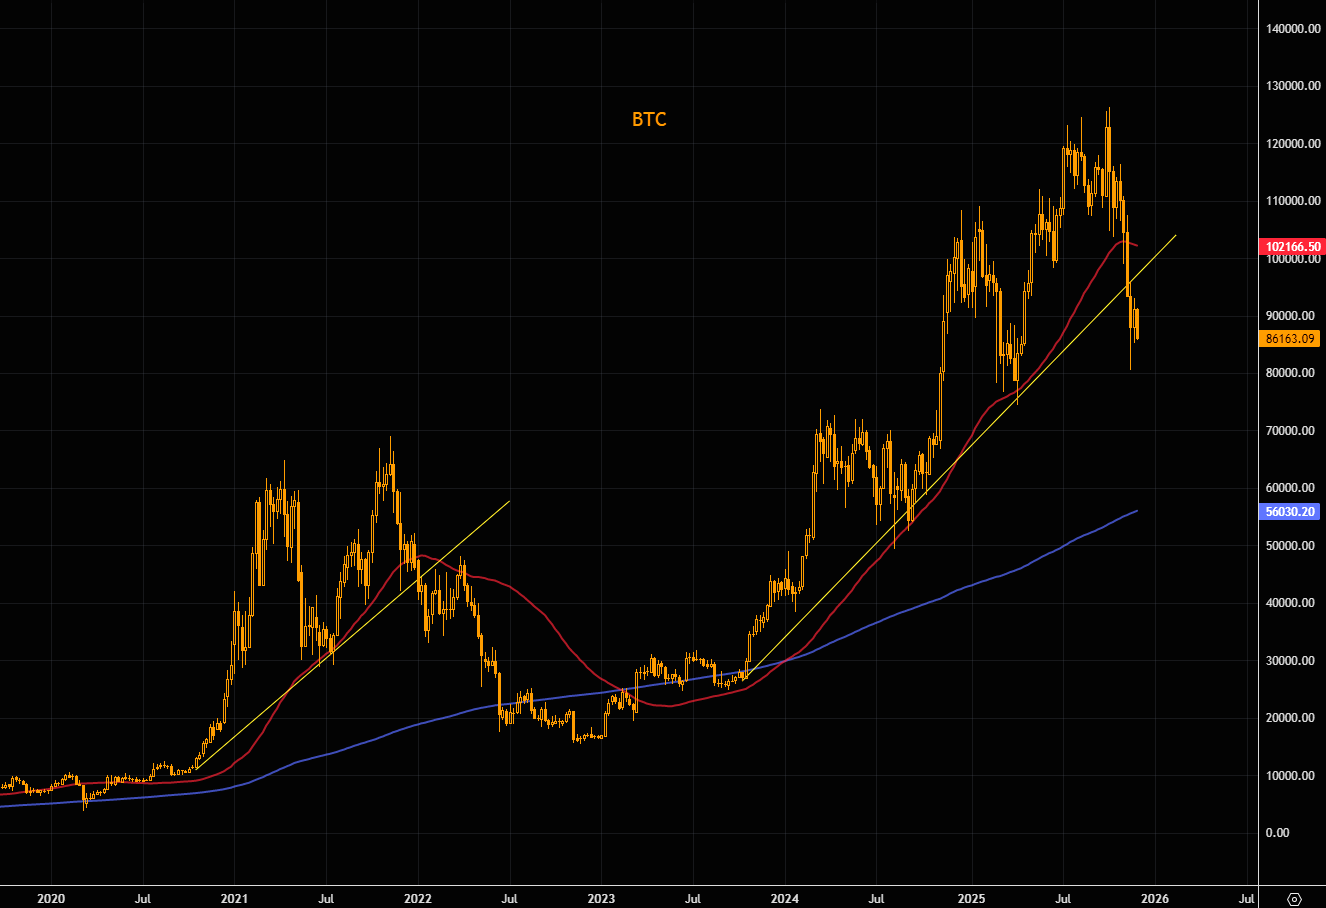
Source: LSEG Workspace
When the going gets tough, the tough get going
There is one store of value and one "everything hedge"....it ain't BTC.
Source: LSEG Workspace
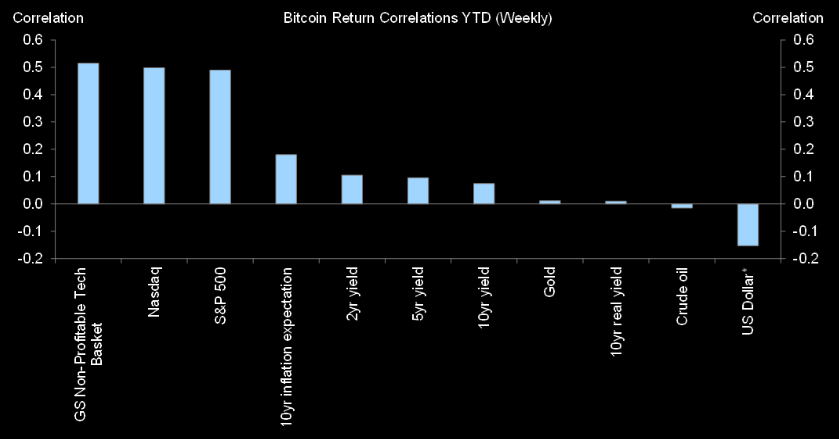
When you trade BTC...
...you basically trade non profitable tech. Not store of value, not dollar debasement, nor other popular narratives.
Source: GS
Upside mania
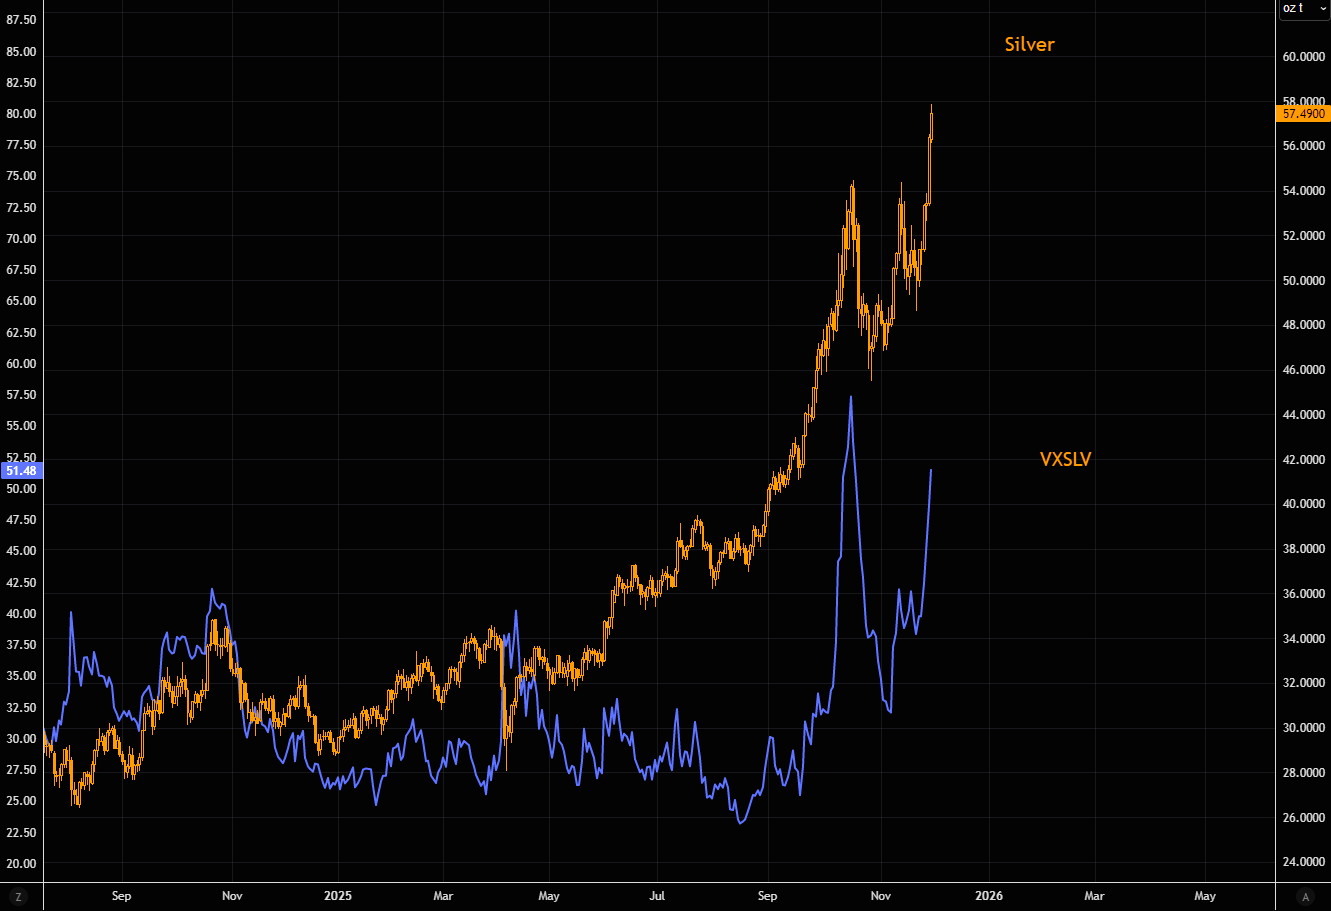
Silver volatility exploding further as the panic to buy upside exposure goes extreme. Full silver note here.
Source: LSEG Workspace
Possible?
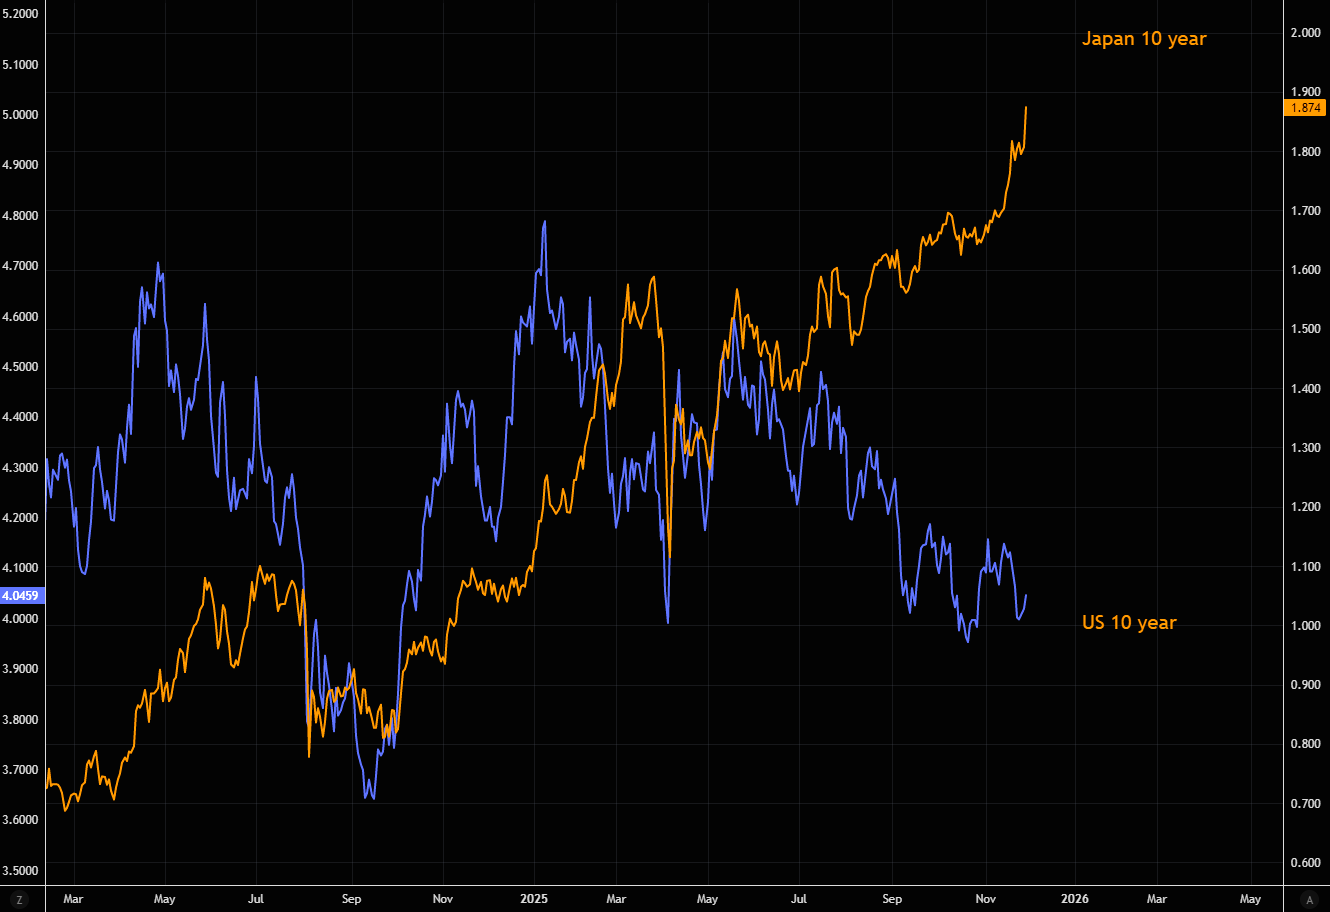
Can the gap between the Japanese and the US 30 yields continue? Chart 1 shows the 10 year, chart 2 the 30 year. Recall what Albert Edwards pointed out on the rates spread last week "...these opposing forces are extreme... and unlikely to coexist for long."
Source: LSEG Workspace
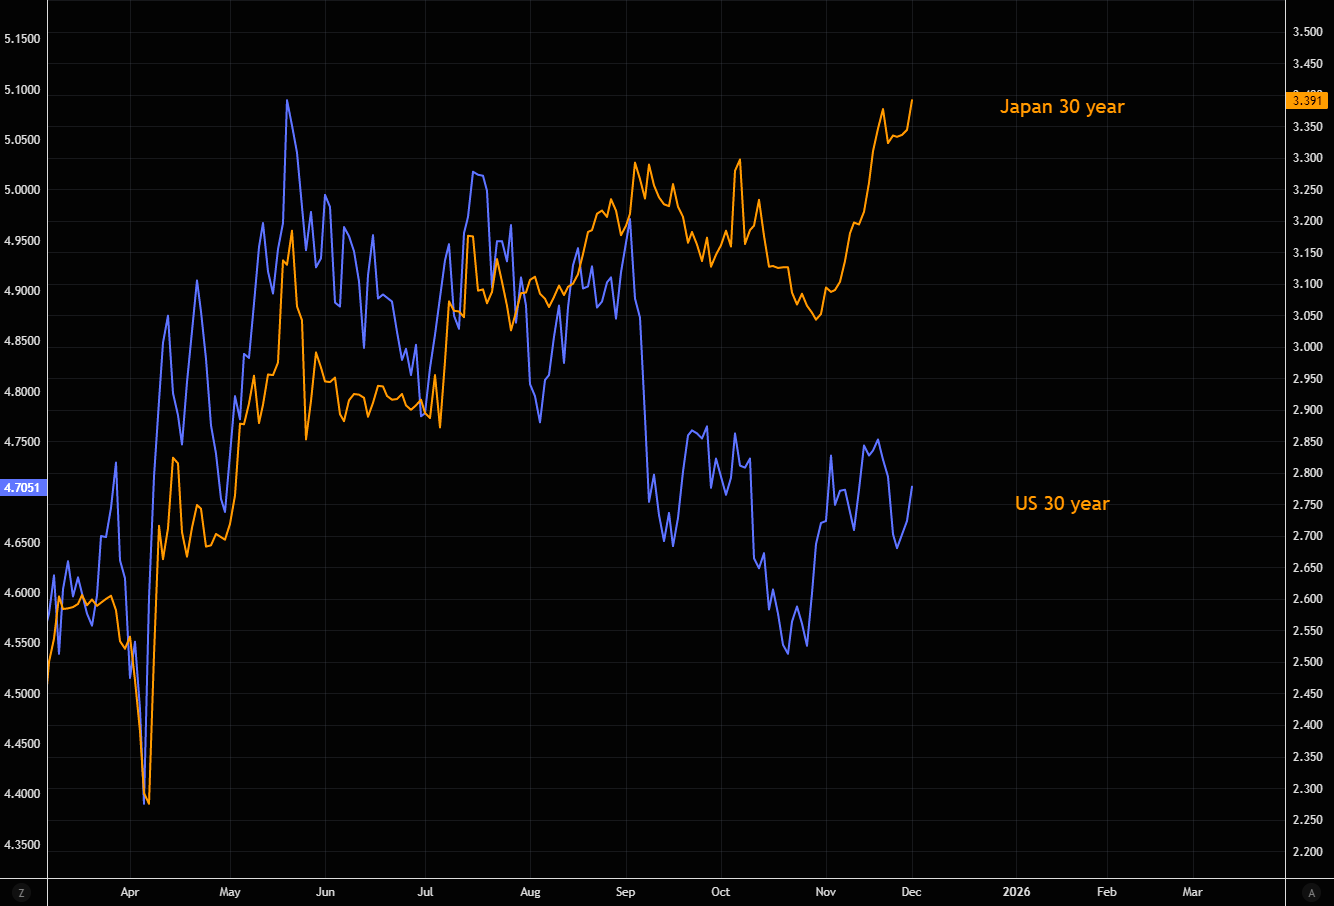
Source: LSEG Workspace
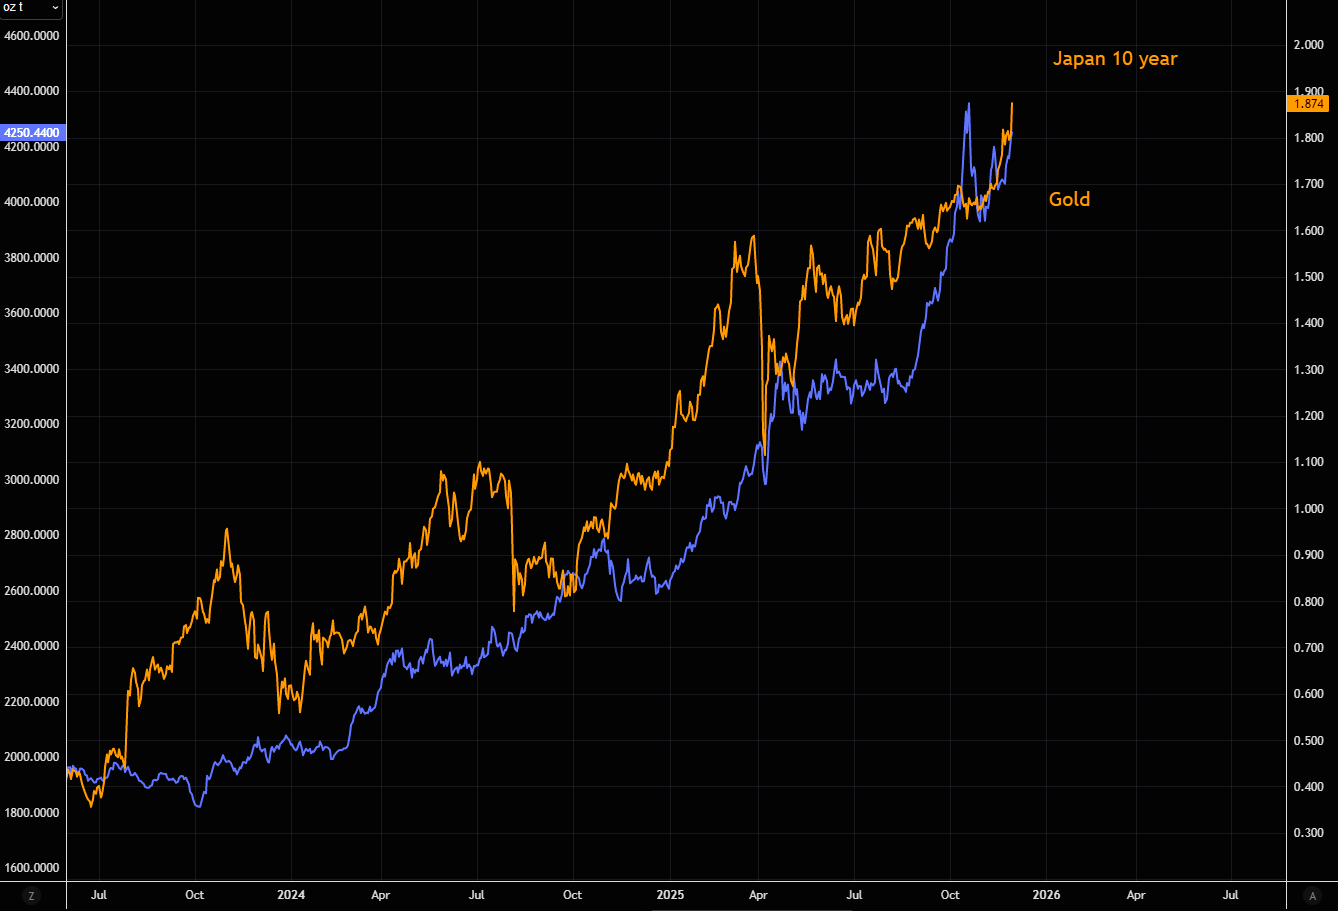
Gold knows
Gold sniffed out what's going on in the Japanese long end a while ago...Latest on the Tokyo Bondquake here.
Source: LSEG Workspace
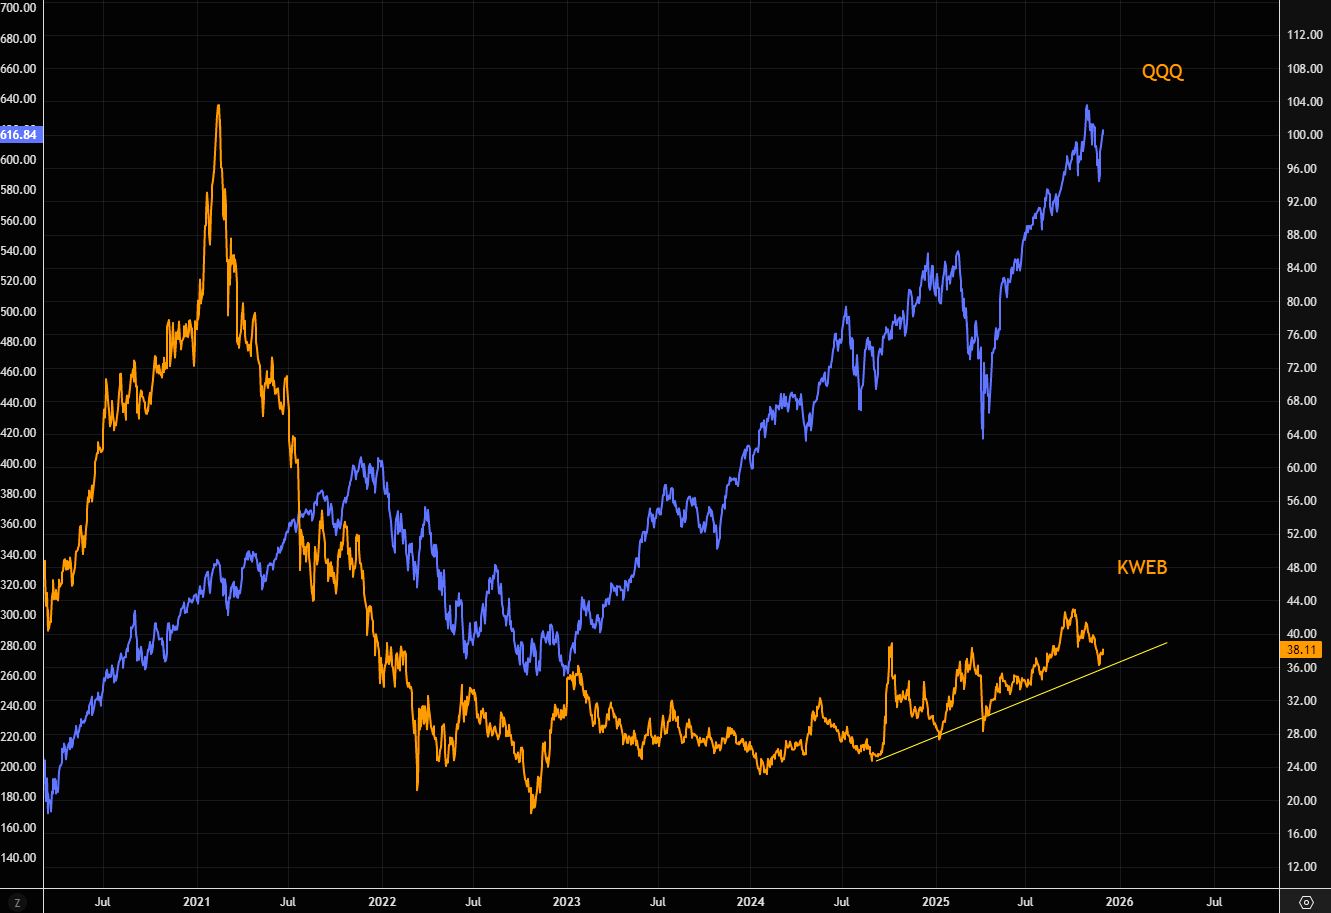
That tech gap
QQQ vs KWEB gap remains one of those massive gaps we like, not as a pairs necessarily, but KWEB as a laggard play. Full China tech note here.
Source: LSEG Workspace
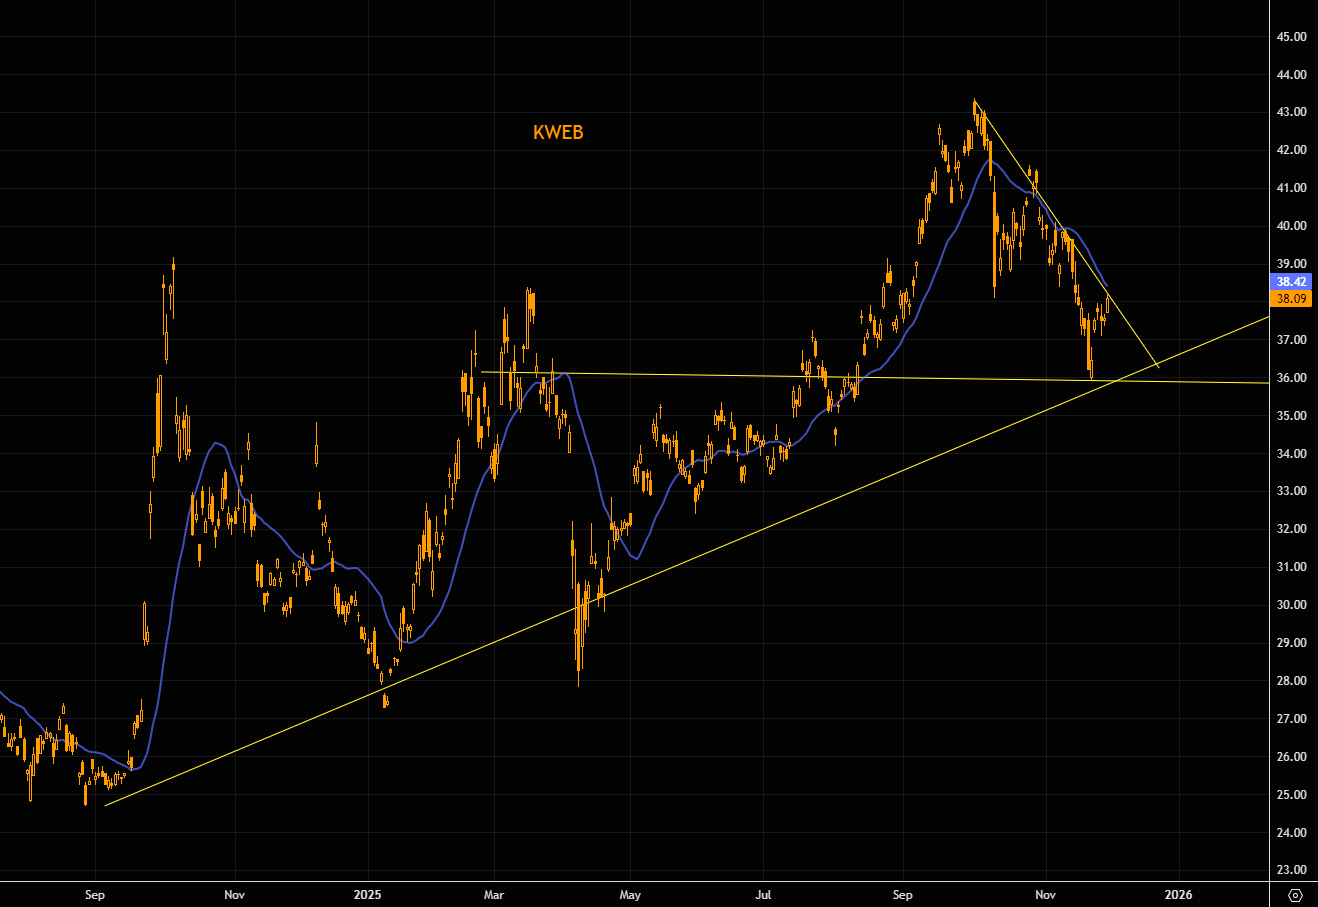
Forgotten
Very little talk about Chinese tech these days, but KWEB has managed rebounding over the past week (perfect bounce off the 200 day). Note we are back to the short term negative trend line and the 21 day. A close slightly higher, and this partly "forgotten tech" space could start squeezing even more.
Source: LSEG Workspace
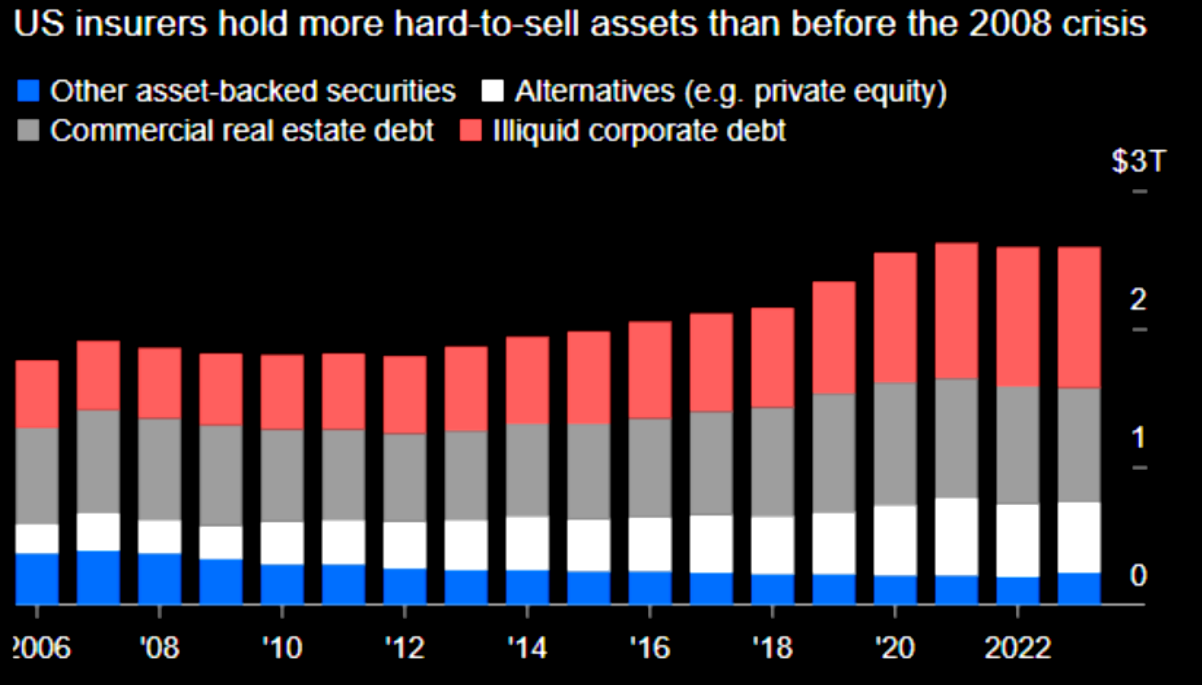
Illiquids
Life insurers now hold $2.5T in illiquid assets (37% of total):
> Up from 31% a decade ago
> Higher than pre-2008 levels
> Capital buffers at two-decade lows
> ST borrowing up 82% to $400B
Investing retirement savings in illiquids while running thinner margins...More "not so bullish" charts here.